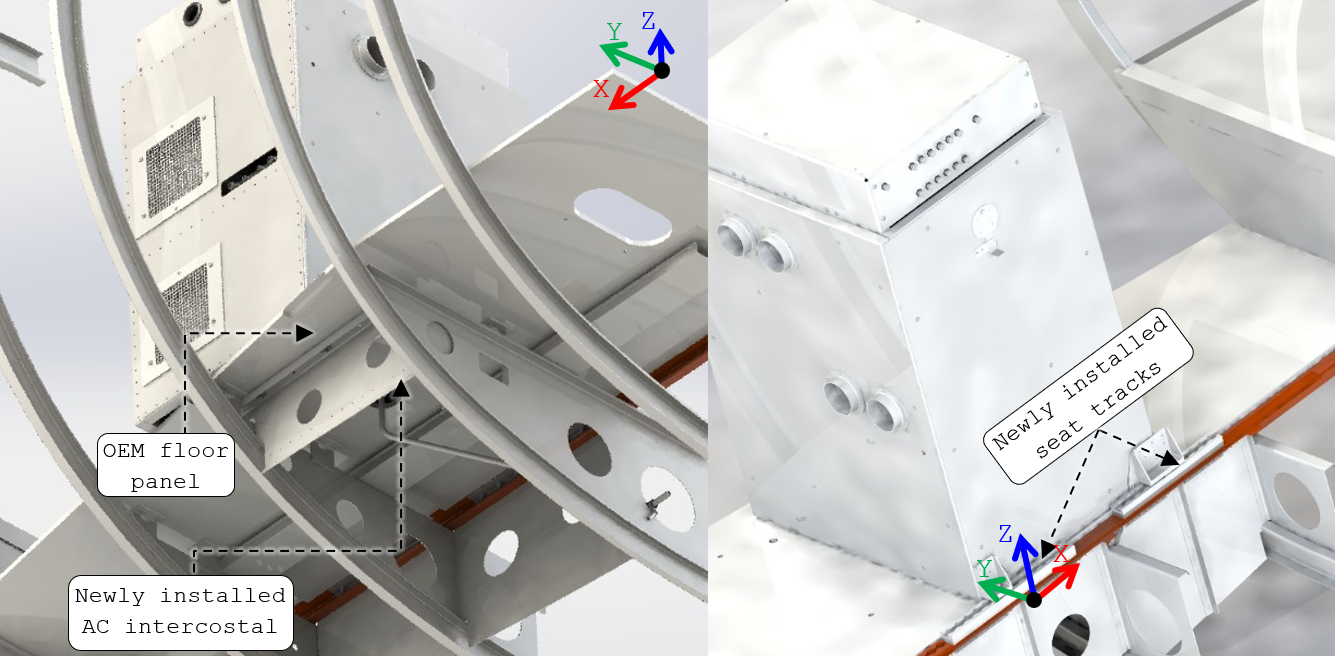
The inboard base reactions enter the aircraft through the newly installed seat-track support path.
INTRODUCTION
AircraftDHC-8-100Interior structural modification
ObjectiveStatic strength substantiationRack, attachments and supporting structure
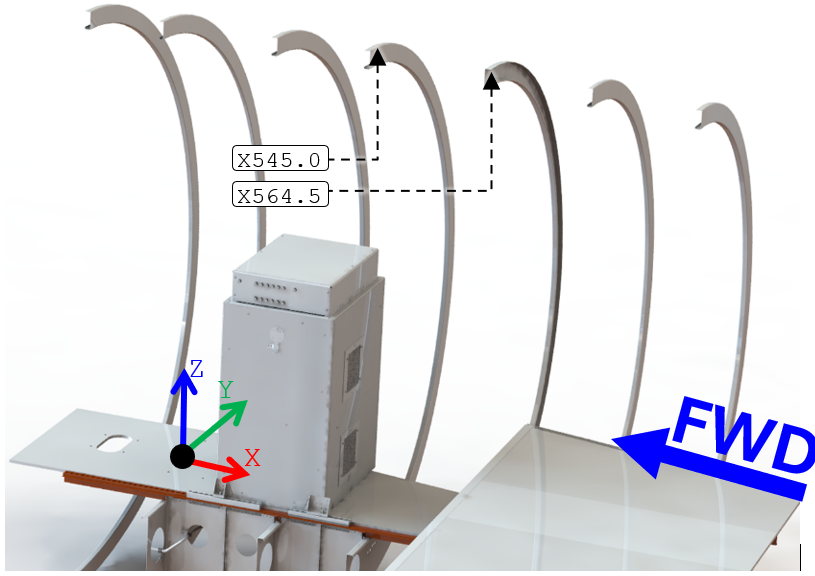
Installation envelopeX545.00 – X580.50Mid/aft cabin floor region
Assessment routeFEA + hand substantiationLoads, joints, stresses, buckling and margins
The substantiation demonstrates that the installed rack and its load path into the DHC-8-100 structure satisfy the applicable ultimate-strength requirements under the governing flight and emergency conditions.
DESIGN ASSESSMENT
The outboard base is supported by the original floor panel reinforced locally by the added intercostal.
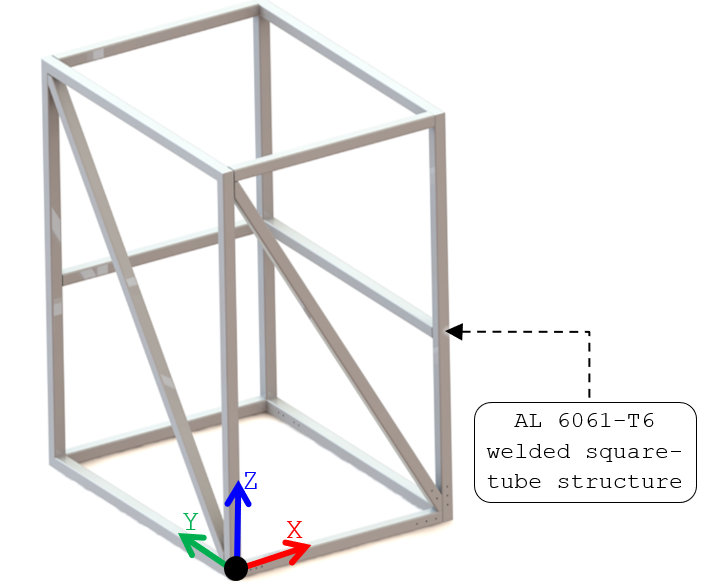
The tube framework provides the principal load-carrying skeleton; aft and outboard skins participate structurally.
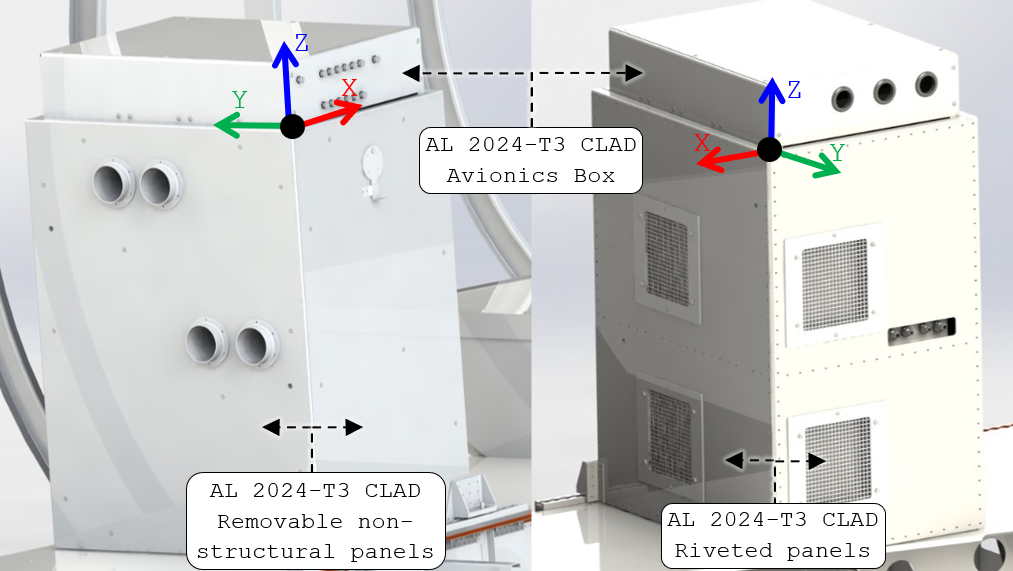
These panels provide access and maintenance functionality and are not credited as primary structural members.
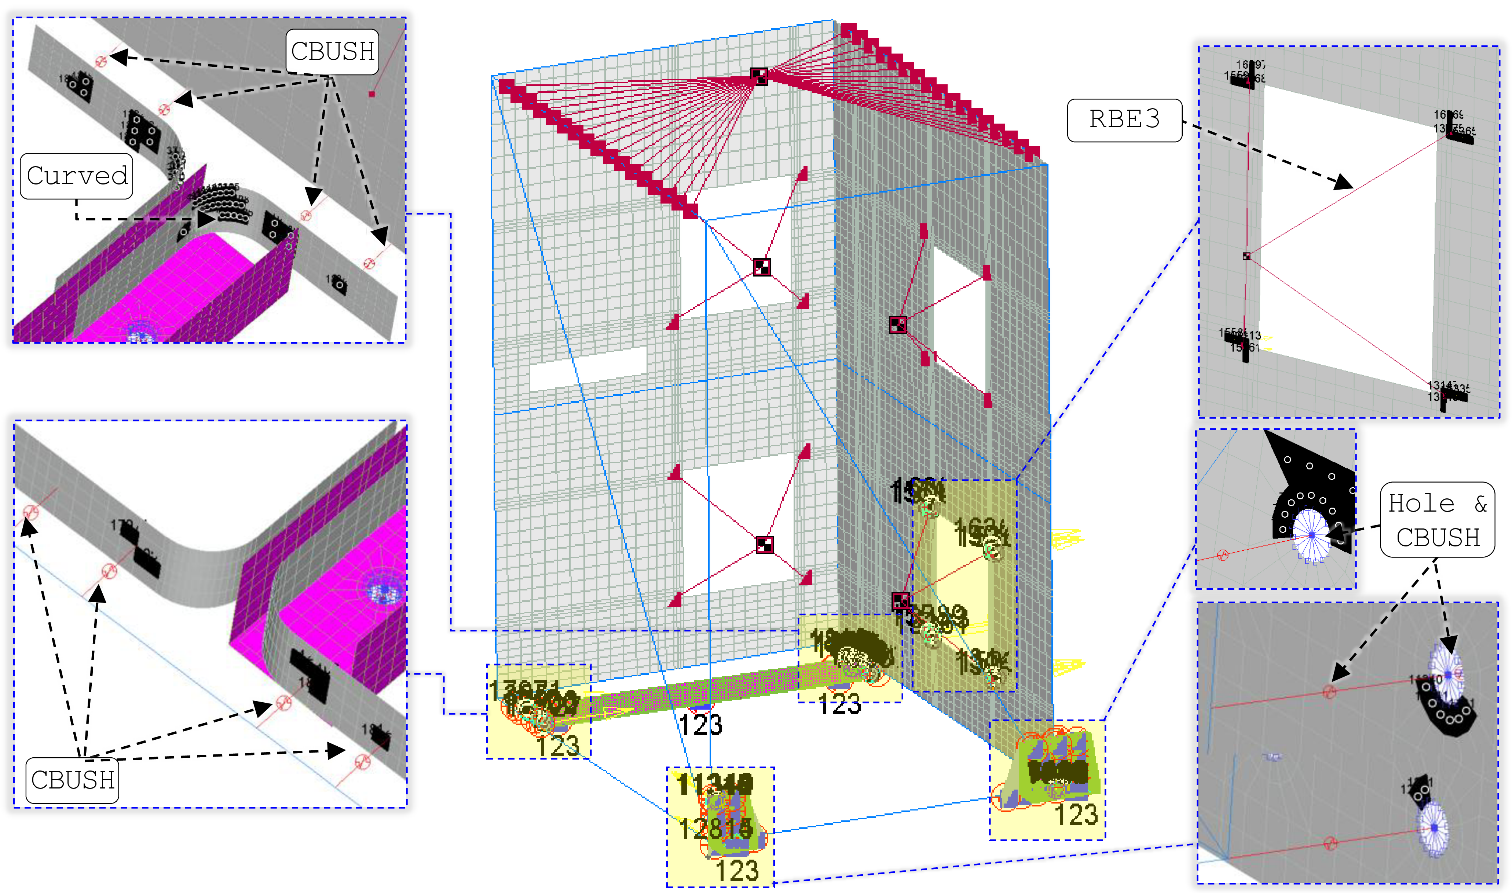
I separated the rack model from the support-structure model because the two questions were different. The rack model needed to distribute equipment inertia through the frame, skin, and attachment fittings. The support model needed local detail around the seat tracks, floor, intercostal, clips, doubler, and brace. Extracting rack reactions and applying them to the support model preserved the load path while keeping each model efficient and auditable.
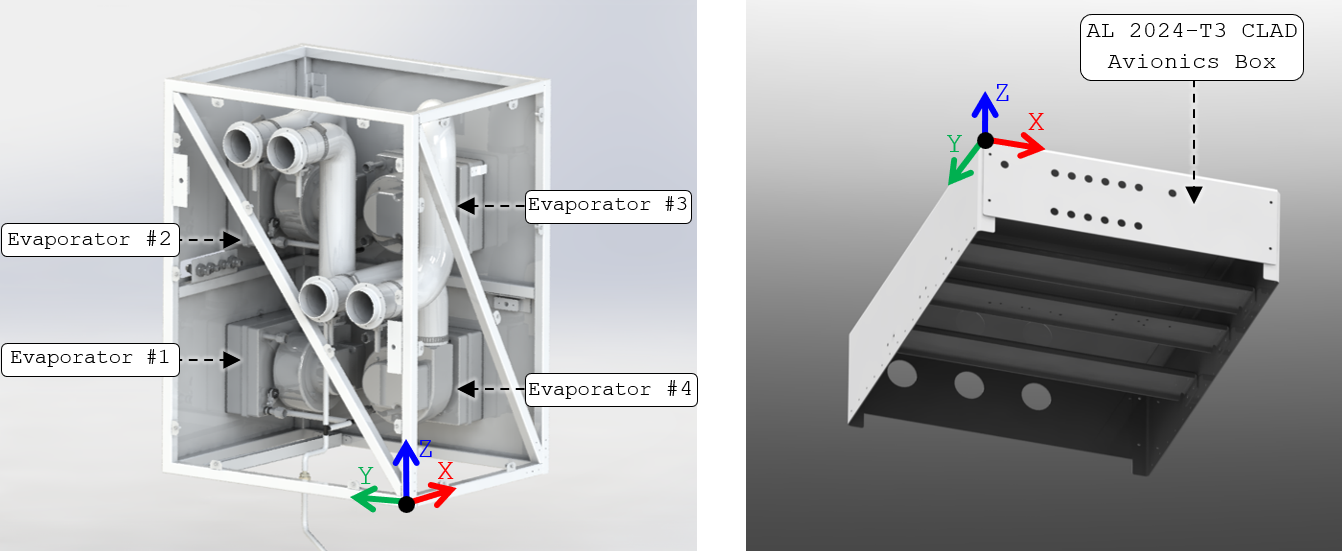
Installation Components
The Air Conditioning Rack is composed of several structural components, as outlined in the table below:
The main structural components of the air conditioning rack.
| Component Name | Thickness [in] |
Material |
|---|---|---|
| AFT and Outboard Skin | 0.071 | AL 2024-T3 CLAD Sheet |
| AFT and FWD Gussets | 0.125 | |
| Two Base Support Clips | 0.125 | |
| Gusset Angle | 0.063 | AL 6061-T6 Extrusion |
| Attachment Angle | 0.125 | |
| Two Rack Mount Fittings | Variable | AL 6061-T6511 Extrusion |
The Supporting Structure underneath the Air Conditioning Rack is composed of several components. The newly added components that will be considered in the FE Analysis are outlined in the table below:
The supporting structural components underneath the air conditioning rack
| Component Name | Thickness [in] |
Material |
|---|---|---|
| FWD and AFT Seat Tracks | 0.53 | AL 7075-T6 Extrusion |
| FWD and AFT Seat Track Support Blocks | 0.38 | AL 2024-T351 Plate |
| AC Intercostal | 0.0625 | AL 2024-T3 CLAD Sheet |
| Intercostal Attachment Brace | ||
| Large Intercostal Clip | ||
| Small Intercostal Clip | ||
| FWD Attachment Doubler |
Installation Weight Estimation
Air Conditioning Rack
Retain stiffness; idealize payload.
Load-bearing geometry remains explicit in the FEM. Equipment and other omitted items are represented at their center of gravity or through distributed non-structural mass so inertia is preserved without adding artificial stiffness.
Hardware / wiring allowance included.
Equipment and applicable component weights include the source 1.15 scaling factor. Material-density estimates are retained for modeled structural items and non-structural components.
Weighted-Average CoG
A worked check for the X-coordinate is:
The same procedure produces and .
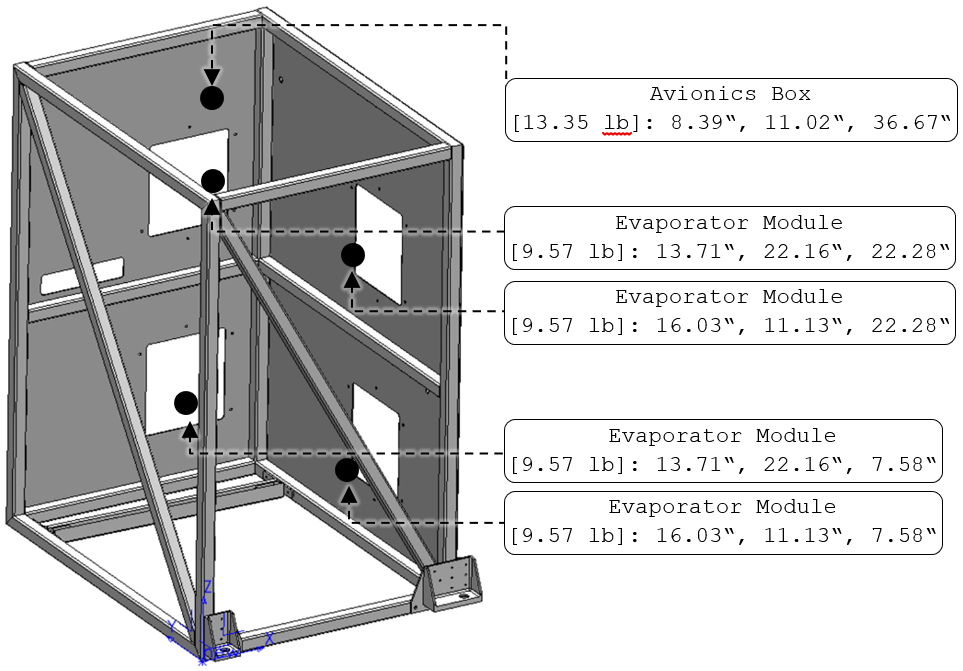
The tables below list the weights of the Modeled Structural Components, the unmodeled non-structural components, and the installed equipment along with their Center of Gravity (CoG) Locations. the figure below illustrates the payloads within the Air Conditioning Rack.
Modeled Structural Components’ Volumes and Weights
| Component | Thickness [in] |
Volume [in3] |
Material | Weight [lb] |
CoG [in] |
||
|---|---|---|---|---|---|---|---|
| X | Y | Z | |||||
| Tube Structure | 0.125 | 178.18 | AL 6061-T6 Extrusion | 17.46 | 9.52 | 12.46 | 16.85 |
| Two Attachment Angles | 8.27 | 0.81 | 9.85 | 21.66 | 0.35 | ||
| Gusset Angle | 0.063 | 0.40 | 0.04 | 20.21 | 0.26 | 1.72 | |
| Rack Mount Fitting | 1.5 | 2.17 | AL 6061-T6511 Extrusion | 0.21 | 1.00 | -0.64 | 1.48 |
| Extended Rack Mount Fitting | 3.66 | 0.36 | 19.05 | -0.63 | 1.39 | ||
| AFT Skin | 0.071 | 55.55 | AL 2024-T3 CLAD Sheet | 5.56 | 19.91 | 13.23 | 17.22 |
| Outboard Skin | 40.53 | 4.05 | 9.36 | 26.04 | 17.30 | ||
| FWD Gusset | 0.125 | 1.03 | 0.10 | 1.33 | -0.06 | 1.62 | |
| AFT Gusset | 1.70 | 0.17 | 18.78 | -0.06 | 1.66 | ||
| Four Base Support Clips | 1.05 | 0.11 | 9.88 | 22.16 | 0.56 | ||
| TOTAL | 28.87 | 11.61 | 14.42 | 15.99 | |||
The volume of the Modeled Structural Components and the unmodeled non-structural components were generated from the 3D model. The weights of the equipment are based on their corresponding manufacturer data sheet, and their CoG locations were generated from the 3D model. It is noteworthy that an additional estimated weight (1.15 times the original weight) has been added to each equipment and component to account for the weight of the hardware, screws, nuts, and wires/cables installed.
the table below summarizes of all Nonstructural and Equipment Weights on the Air Conditioning Rack, along with the equivalent CoG location relative to the FWD inboard lower corner. It is noteworthy that the Non-Structural Components and Equipment will be omitted from the analysis. However, to account for their effect, the total weight of these components will be added to the FE model as a non-structural mass distributed over the tube structure.
The weights were estimated based on material density of 0.1 lb/in3 for AL 2024-T3 CLAD Sheet, 0.098 lb/in3 for AL 6061-T6 and T6511 Extrusion, 0.0578 lb/in3 for Silicon Rubber, 0.0379 lb/in3 for Polyurethane Rubber, 0.0596 lb/in3 for Nylon Plastic, 0.282 lb/in3 for Galvanized Steel, and 0.0452 lb/in3 for Neoprene. Moreover, the avionics box is fixed to the FWD and AFT beams through 17 ARN/4 (CR3213) at each side. It is considered as a payload on the Air Conditioning Rack FEM.
Equipment and non-structural components weights and their CoG locations.
| Component/Equipment | Volume [in3] |
Material/Vendor | Weight [lb] |
Scaled Weight [lb] |
Qty | Total Weight [lb] |
CoG [in] |
||
|---|---|---|---|---|---|---|---|---|---|
| X | Y | Z | |||||||
| Avionics Box | |||||||||
| CB Panel | 6.18 | AL 2024-T3 CLAD Sheet | 0.62 | N/R | 1 | 0.62 | 8.39 | 11.02 | 36.67 |
| Top Panel | 25.83 | 2.58 | N/R | 1 | 2.58 | ||||
| Side Panel | 10.77 | 1.08 | N/R | 2 | 2.15 | ||||
| Outboard Panel | 5.9 | 0.59 | N/R | 1 | 0.59 | ||||
| Mounting Bracket | 4.09 | 0.41 | N/R | 3 | 1.23 | ||||
| Terminal Junction Modules | N/R | AMPHENOL | 0.05 | 0.06 | 2 | 0.12 | |||
| N/R | 0.05 | 0.06 | 2 | 0.12 | |||||
| N/R | 0.05 | 0.06 | 1 | 0.06 | |||||
| N/R | 0.05 | 0.06 | 5 | 0.3 | |||||
| N/R | 0.03 | 0.03 | 1 | 0.03 | |||||
| N/R | 0.03 | 0.03 | 1 | 0.03 | |||||
| N/R | 0.03 | 0.03 | 1 | 0.03 | |||||
| N/R | 0.03 | 0.03 | 4 | 0.12 | |||||
| Mounting Track | 2.37 | 0.24 | 0.28 | 2 | 0.56 | ||||
| Circuit Breaker, 90A | N/R | KLIXON | 0.25 | 0.29 | 2 | 0.58 | |||
| Circuit Breaker, 20A | N/R | 0.06 | 0.07 | 2 | 0.14 | ||||
| Circuit Breaker, 15A | N/R | 0.06 | 0.07 | 4 | 0.28 | ||||
| Circuit Breaker, 5A | N/R | 0.06 | 0.07 | 2 | 0.14 | ||||
| Circuit Breaker, 2A | N/R | 0.06 | 0.07 | 4 | 0.28 | ||||
| Relay 50Amp | N/R | TYCO ELECTRONICS | 0.20 | 0.23 | 2 | 0.46 | |||
| Relay | N/R | LEACH | 0.16 | 0.18 | 2 | 0.36 | |||
| Relay | N/R | 0.19 | 0.22 | 4 | 0.88 | ||||
| Relay | N/R | 0.10 | 0.12 | 2 | 0.24 | ||||
| Relay Socket, 12 Amp | N/R | 0.08 | 0.09 | 2 | 0.18 | ||||
| Relay Socket | N/R | 0.12 | 0.14 | 4 | 0.56 | ||||
| Relay Socket | N/R | 0.12 | 0.14 | 2 | 0.28 | ||||
| Dc-Dc Converter | N/R | VICOR | 0.15 | 0.17 | 2 | 0.34 | |||
| Grommet | 0.61 | Rubber Synthetic Overall | 0.03 | 0.03 | 3 | 0.09 | |||
| Subtotal | 13.35 | 8.39 | 11.02 | 36.67 | |||||
| Four Evaporator Module Assemblies | |||||||||
| Vent Cover | 2.73 | AL 2024-T3 CLAD Sheet | 0.27 | 0.31 | 1 | 0.31 | 16.03, 11.13, 22.28 (aft top) 16.03, 11.13, 7.58 (aft, bottom) 13.71, 22.16, 22.28 (outboard, top) 13.71, 22.16, 7.58 (outboard, bottom) |
||
| Vent Shim | 1.57 | AL 2024-T3 CLAD Sheet | 0.16 | 0.18 | 1 | 0.18 | |||
| Mesh | 1.31 | Galvanized Steel | 0.37 | 0.43 | 1 | 0.43 | |||
| Gasket | 6.02 | Neoprene | 0.27 | 0.31 | 1 | 0.31 | |||
| Evaporator Module | N/R | N/R | 7.25 | 8.34 | 1 | 8.34 | |||
| Subtotal | 9.57 EACH | N/R | |||||||
| Non-Structural Components and Equipment | |||||||||
| Forward Skin | 52.6 | AL 2024-T3 CLAD Sheet | 5.26 | 6.05 | 1 | 6.05 | N/R | ||
| Inboard Skin | 40.35 | 4.04 | 4.64 | 1 | 4.64 | ||||
| Fire Port Cover | 0.36 | AL 6061-T6 CLAD Sheet | 0.04 | 0.04 | 1 | 0.04 | |||
| Fire Port Stop | 0.08 | 0.01 | 0.01 | 1 | 0.01 | ||||
| 3.0" Flange Base | 0.37 | 0.04 | 0.04 | 4 | 0.17 | ||||
| 3.0" Flange | 1.82 | AL 6061-T6 Tube | 0.18 | 0.21 | 4 | 0.84 | |||
| 3.0" Scat Hose | 21.14 | Silicon Rubber | 1.22 | 1.41 | 4 | 5.62 | |||
| 3/8" Abrasion Resistant Tubing | 0.47 | Polyurethane Rubber | 0.02 | 0.02 | 7 | 0.14 | |||
| 3/8" Tube to 3/8" NPT Female Swivel Adapter | 0.33 | Nylon Plastic | 0.02 | 0.02 | 1 | 0.02 | |||
| 3/8" Tube to 3/8" NPT Male Adapter | 0.19 | Nylon Plastic | 0.01 | 0.01 | 1 | 0.01 | |||
| 3/8" Barbed Tee | 0.35 | Nylon Plastic | 0.02 | 0.02 | 3 | 0.07 | |||
| 4.0" Aluminum Flange | 1.29 | Aluminum | 0.13 | 0.15 | 4 | 0.59 | |||
| Airflow Switch | N/R | N/R | 0.20 | 0.23 | 4 | 0.92 | |||
| Subtotal | 19.13 | N/R | |||||||
| TOTAL | 70.76 | N/R | |||||||
Summary of Structural, Nonstructural, and Equipment Weights
| Component | Weight [lb] |
CoG [in] |
||
|---|---|---|---|---|
| X | Y | Z | ||
| Modeled Structural Components | 28.87 | 11.61 | 14.42 | 15.99 |
| Avionics Box | 13.35 | 8.39 | 11.02 | 36.67 |
| Evaporator Module Assembly No 1 | 9.57 | 16.03 | 11.13 | 22.28 |
| Evaporator Module Assembly No 2 | 9.57 | 16.03 | 11.13 | 7.58 |
| Evaporator Module Assembly No 3 | 9.57 | 13.71 | 22.16 | 22.28 |
| Evaporator Module Assembly No 4 | 9.57 | 13.71 | 22.16 | 7.58 |
| subtotal | 80.50 | 12.63 | 14.91 | 18.92 |
| Non-Structural Components and Equipment | 19.13 | N/R | N/R | N/R |
| TOTAL | 99.63 | N/R | N/R | N/R |
Based on the above table, the total weight of the parts to be modeled is 80.50 lbf. However, the total weight of the model in FEM is 81.839 lbf (1.339 lbf more) due to the simplifications performed on the modeled parts (i.e. covering holes, removing curved edges, and other geometry simplification). Hence, the non-structural mass to be added to the model was reduced from 19.13 lbf to 17.791 lbf. This mass was added, as a distributed load, to the entire tube structure.
Supporting Structure
Supporting-structure mass model. Only newly added structural parts are retained explicitly. A 15% non-structural mass allowance is distributed over the modeled support elements to account for installed hardware without adding unnecessary geometric detail.
Modeled Structural Components’ Volumes and Weights
| Component | Part No | Thickness [in] |
Volume [in3] |
Material | Weight [lb] |
|---|---|---|---|---|---|
| FWD and AFT Seat Tracks | 40467-10-144 | 0.53 | N/R | AL 7075-T6 Extrusion | 1.23 |
| FWD and AFT Seat Track Support Blocks | 002-2302101-141, -143 | 0.38 | 11.62 | AL 2024-T351 Plate | 1.16 |
| AC Intercostal | 002-2302101-111 | 0.0625 | 11.03 | AL 2024-T3 Sheet | 1.10 |
| Intercostal Attachment Brace | 002-2302101-121 | 2.84 | 0.29 | ||
| Large Intercostal Clip | 002-2302101-127 | 0.65 | 0.07 | ||
| Small Intercostal Clip | 002-2302101-125 | 0.42 | 0.04 | ||
| FWD Attachment Doubler | 002-2302101-109 | 1.74 | 0.18 | ||
| TOTAL | 4.07 | ||||
It is noteworthy that weights were estimated based on material density of 0.1 lb/in3 for AL 2024-T3 Sheet and for AL 2024-T351 Plate. Moreover, an additional estimated weight of 0.15 times the original weight (0.15x4.07=0.61 lbf) has been applied in the FEM as non-structural mass distributed over the modeled structural elements. This additional weight is to account for the weight of the hardware, screws, and nuts installed.
Material Properties
The table below lists the mechanical properties [per MMPDS-15] of the materials used in the Air Conditioning Rack Installation and its Supporting Structure.
Material properties used in the Air Conditioning Rack Installation and its supporting structure.
AL 6061-T6 and T6511 Extrusion t≤1” |
AL 6061-T6 and T6511 Extrusion t=1.001”-6.5” |
AL 7075-T62 CLAD sheet t=0.04” – 0.062” |
AL 7075-T6 Extrusion t=0.25” – 0.499” |
AL 2024-T351 Plate t=0.25” – 0.499” |
AL 2024-T3 CLAD Sheet t=0.063” – 0.128” |
AL 2024-T3 Sheet t=0.010” – 0.128” |
Unit | |
|---|---|---|---|---|---|---|---|---|
| Ftu | 38 | 38 | 69 | 81 | 64 | 62 | 64 | ksi |
| Fty | 35 | 35 | 61 | 73 | 48 | 45 | 47 | ksi |
| Fcy | 34 | 34 | 62 | 73 | 39 | 37 | 39 | ksi |
| Fsu | 26 | 19 | 47 | 43 | 38 | 38 | 39 | ksi |
| Fbru | 82 | 69 | 142 | 146 | 119 | 125 | 129 | ksi |
| Fbry | 60 | 50 | 109 | 113 | 86 | 84 | 88 | ksi |
| E x103 | 9.90 | 9.90 | 10.3 | 10.4 | 10.7 | 10.50 | 10.5 | ksi |
| Ec x103 | 10.10 | 10.10 | 10.5 | 10.7 | 10.9 | 10.70 | 10.7 | ksi |
| μ | 0.33 | 0.33 | 0.33 | 0.33 | 0.33 | 0.33 | 0.33 | - |
| ρ | 0.098 | 0.098 | 0.101 | 0.101 | 0.1 | 0.1 | 0.1 | lbm/in3 |
| G x103 | 3.80 | 3.8 | - | 4.0 | 4.0 | - | 4.0 | ksi |
| e | 8 or 10 | 10 | 9 | 7 | 12 | 15 | 12 or 15 | % |
Fasteners Allowables
Joint allowable philosophy
Use the weakest applicable failure path for the actual fastener / sheet stack rather than the isolated fastener strength.
Sheet thickness and material alter joint strength.Countersunk geometry uses the applicable static-joint reduction.Bearing is checked at the critical sheet / hole interface.
Summary of the fasteners utilized in the Air Conditioning Rack Installation and its Supporting Structure.
| LOCATION | Layer 1 | Layer 2 | Layer 3 | Qty | Joint No. |
|---|---|---|---|---|---|
| ANCRA Single Stud Fitting (P/N 49184-10) that consists of a stud and a lock (P/N FE200744). | |||||
| Point 1 | Stud Lock | Extended Rack Mount Fitting | 1 | J1 | |
| Point 2 | Stud Lock | Rack Mount Fitting | 1 | J2 | |
| ARN/4N (CR3213) Rivets | |||||
| Point 1 | Extended Rack Mount Fitting | AFT Gusset | Tube structure | 5 | J3 |
| Point 2 | Rack Mount Fitting | FWD Gusset | Tube structure | 3 | J4 |
| Points 5 and 9 | Base Support Clips | Tube structure | 2 | J5 | |
| Avionics Box | Avionics Box Side Panel | Tube structure | 17 | J6 | |
| ARM/4 (CR3212) Rivets | |||||
| Point 1 | Gusset Angle | AFT Panel | Tube structure | 3 | J7 |
| Point 1 | AFT Gusset | Tube structure | 4 | J8 | |
| Point 2 | FWD Gusset | Tube structure | 5 | J9 | |
| AFT and Outboard Panels | AFT and Outboard Skin | Tube structure | 1-inch typical pitch | J10 | |
| BJ/4N (MS20470AD4) Rivets | |||||
| Point 1 | Extended Rack Mount Fitting | AFT Gusset | Gusset Angle | 3 | J11 |
| Point 2 | Rack Mount Fitting | FWD Gusset | 3 | J12 | |
| Point 1 | Seat Track Support Angles | Shim | T-section Track | 7 | J13 |
| Point 1 | Seat Track Support Angles | Bay Support | T-section Track | 7 | J14 |
| Point 2 | Seat Track Support Angles | Shim | T-section Track | 9 | J15 |
| Point 2 | Seat Track Support Angles | Bay Support | T-section Track | 9 | J16 |
| Points 5 and 9 | Base Support Clips | Attachment Angle | 2 | J17 | |
| Supporting Structure | Intercostal | Large Intercostal Clip | 4 | J18 | |
| Supporting Structure | Large Intercostal Clip | Attachment Doubler | 5 | J19 | |
| Supporting Structure | Large Intercostal Clip | Existing X545 web frame | 23 | J20 | |
| Supporting Structure | Intercostal | Small Intercostal Clip | 3 | J21 | |
| Supporting Structure | Small Intercostal Clip | Existing X564.5 web frame | 3 | J22 | |
| Supporting Structure | Intercostal | Attachment Brace | 15 | J23 | |
| Supporting Structure | Attachment Brace | Existing stringer 26S | 15 | J24 | |
| BB/4N (MS20426AD4) Rivets | |||||
| Point 1 | AFT Gusset | Gusset Angle | 1 | J25 | |
| NAS8603-12 CSK screws | |||||
| Point 1 | Seat Track Support Block | Seat Track Support Angle | T-section Track | 8 | J26 |
| Point 2 | Seat Track Support Block | Seat Track Support Angle | T-section Track | 12 | J27 |
| MS24694-S49 CSK Screws and MS21209F1-15P Helicoils | |||||
| Point 1 | Seat Track | Seat Track Support Block | 7 | J28 | |
| Point 2 | Seat Track | Seat Track Support Block | 8 | J29 | |
| AN4-11A Bolts and NAS1834-4-500 Inserts | |||||
| Points 6, 7, and 8 | Two Attachment Angles | Intercostal | 1 | J30 | |
Summary of the joints utilized in the Air Conditioning Rack Installation and its Supporting Structure.
| LOCATION | Layer 1 | Layer 2 | Layer 3 | Joint No. |
|---|---|---|---|---|
| ANCRA Single Stud Fitting (P/N 49184-10) that consists of a stud and a lock (P/N FE200744). | ||||
| Point 1 | 0.08” thick Carbon Steel | 0.25” thick AL 6061-T6511 Extrusion | 1 | |
| Point 2 | 0.08” thick Carbon Steel | 0.25” thick AL 6061-T6511 Extrusion | 2 | |
| ARN/4N (CR3213) Rivets | ||||
| Point 1 | 1.5” thick AL 6061-T6511 Extrusion | 0.125” thick AL 2024-T3 CLAD Sheet | 0.125” thick AL 6061-T6 Extrusion | 3 |
| Point 2 | 1.5” thick AL 6061-T6511 Extrusion | 0.125” thick AL 2024-T3 CLAD Sheet | 0.125” thick AL 6061-T6 Extrusion | 4 |
| Points 5 and 9 | 0.125” thick AL 2024-T3 CLAD Sheet | 0.125” thick AL 6061-T6 Extrusion | 5 | |
| Avionics Box | 0.0625” thick AL 2024-T3 Sheet | 0.125” thick AL 6061-T6 Extrusion | 6 | |
| ARM/4 (CR3212) Rivets | ||||
| Point 1 | 0.063” thick AL 6061-T6 Extrusion | 0.071” thick AL 2024-T3 CLAD Sheet | 0.125” thick AL 6061-T6 Extrusion | 7 |
| Point 1 | 0.125” thick AL 2024-T3 CLAD Sheet | 0.125” thick AL 6061-T6 Extrusion | 8 | |
| Point 2 | 0.125” thick AL 2024-T3 CLAD Sheet | 0.125” thick AL 6061-T6 Extrusion | 9 | |
| AFT and Outboard Panels | 0.071” thick AL 2024-T3 CLAD Sheet | 0.125” thick AL 6061-T6 Extrusion | 10 | |
| BJ/4N (MS20470AD4) Rivets | ||||
| Point 1 | 1.5” thick AL 6061-T6511 Extrusion | 0.125” thick AL 2024-T3 CLAD Sheet | 0.063” thick AL 6061-T6 Extrusion | 11 |
| Point 2 | 1.5” thick AL 6061-T6511 Extrusion | 0.125” thick AL 2024-T3 CLAD Sheet | 12 | |
| Point 1 | 0.063” thick AL 6061-T6 Extrusion | 0.05” thick AL 2024-T3 CLAD Sheet | AL 7075-T73 Extrusion | 13 |
| Point 1 | 0.063” thick AL 6061-T6 Extrusion | 0.025” thick AL 2024-T3/T42 CLAD Sheet | AL 7075-T73 Extrusion | 14 |
| Point 2 | 0.063” thick AL 6061-T6 Extrusion | 0.05” thick AL 2024-T3 CLAD Sheet | AL 7075-T73 Extrusion | 15 |
| Point 2 | 0.063” thick AL 6061-T6 Extrusion | 0.025” thick AL 2024-T3/T42 CLAD Sheet | AL 7075-T73 Extrusion | 16 |
| Points 5 and 9 | 0.125” thick AL 2024-T3 CLAD Sheet | 0.125” thick AL 6061-T6 Extrusion | 17 | |
| Supporting Structure | 0.0625” thick AL 2024-T3 Sheet | 0.0625” thick AL 2024-T3 Sheet | 18 | |
| Supporting Structure | 0.0625” thick AL 2024-T3 Sheet | 0.0625” thick AL 2024-T3 Sheet | 19 | |
| Supporting Structure | 0.0625” thick AL 2024-T3 Sheet | 0.05” thick AL 7075-T62 CLAD Sheet | 20 | |
| Supporting Structure | 0.0625” thick AL 2024-T3 Sheet | 0.0625” thick AL 2024-T3 Sheet | 21 | |
| Supporting Structure | 0.0625” thick AL 2024-T3 Sheet | 0.04” thick AL 7075-T62 CLAD Sheet | 22 | |
| Supporting Structure | 0.0625” thick AL 2024-T3 Sheet | 0.0625” thick AL 2024-T3 Sheet | 23 | |
| Supporting Structure | 0.0625” thick AL 2024-T3 Sheet | AL 7075-T62 Extrusion | 24 | |
| BB/4N (MS20426AD4) Rivets | ||||
| Point 1 | 0.125” thick AL 2024-T3 CLAD Sheet | 0.063” thick AL 6061-T6 Extrusion | 25 | |
| NAS8603-12 CSK screws | ||||
| Point 1 | 0.38” thick AL 2024-T351 Plate | 0.063” thick AL 6061-T6 Extrusion | AL 7075-T73 Extrusion | 26 |
| Point 2 | 0.38” thick AL 2024-T351 Plate | 0.063” thick AL 6061-T6 Extrusion | AL 7075-T73 Extrusion | 27 |
| MS24694-S49 CSK Screws and MS21209F1-15P Helicoils | ||||
| Point 1 | 0.53” thick AL 7075-T6 Extrusion | 0.38” thick AL 2024-T351 Plate | 28 | |
| Point 2 | 0.53” thick AL 7075-T6 Extrusion | 0.38” thick AL 2024-T351 Plate | 29 | |
| AN4-11A Bolts and NAS1834-4-500 Inserts | ||||
| Points 6, 7, and 8 | 0.125” thick AL 6061-T6 Extrusion | 0.0625” thick AL 2024-T3 Sheet | 30 | |
CR3212 Rivets
CR3212 · ARM4
Type Countersunk blind rivetNominal size 1/8 inSingle shear 664 lbfTension 285 lbfRivet / hole Ø 0.125 / 0.1285 inApplied joints J7–J10
Rivet’s Shear Strength:
The shear strengths at the aforementioned joints depend on the CSK sheet thickness. Using [MMPDS-15-Table 8.1.3.2.2(v)], these shear strengths can be calculated as below:
J7 [tCSK=0.063”] : 401x(50/51)x2 = 786 lbf. (double shear configuration)
J8 [tCSK=0.125”] : 594x(50/51) = 582 lbf.
J9 [tCSK=0.125”] : 594x(50/51) = 582 lbf.
J10 [tCSK=0.071”]: 437x(50/51) = 428 lbf.
It is noteworthy that the values in [MMPDS-15-Table 8.1.3.2.2(v)] are for Fsu=51 ksi, and the ultimate shear strength of the fastener material Fsu=50 ksi [MMPDS-15-Table 8.1.1.2]. Therefore, the joint’s shear strength was scaled down by a factor of 50/51.
Joint Bearing strength:
The non-CSK sheet is thicker than the CSK sheet in this joint. Therefore, calculating the joint ultimate bearing strength is not required.
Rivet’s Tensile Strength:
The tensile strength value of ftu=285 lbf is based on 0.156” thick CSK sheet [Technical Data Sheet-Cherrymax Rivets]. Therefore, the estimated tensile strengths at the aforementioned joints are as below:
J7 [tCSK=0.063”] : 285x(0.063/0.156) = 115 lbf.
J8 [tCSK=0.125”] : 285x(0.125/0.156) = 228 lbf.
J9 [tCSK=0.125”] : 285x(0.125/0.156) = 228 lbf.
J10 [tCSK=0.071”]: 285x(0.071/0.156) = 129 lbf.
CR3213 Rivets
CR3213 · ARN4
Type Protruding blind rivetNominal size 1/8 inSingle shear 664 lbfTension 285 lbfRivet / hole Ø 0.125 / 0.1285 inApplied joints J3–J6
Rivet’s Shear Strength:
The rivets utilised in joints J3-J4 configuration are in double shear state and have Dr/tmin = 1 < 1.5, and the rivets utilised in joints J5-J6 configuration are in single shear state and have Dr/tmin = 2 < 3. Therefore, no correction factor, , is needed, and the ultimate shear strength remains fsu=664 lbf.
The Static Joint Strengths at the aforementioned joints depend on the thinnest sheet thickness, and it can be calculated as below [MMPDS-15-Table 8.1.3.2.2(v), MMPDS-15-Table 8.1.3.1.2(p)]:
J3 [tmin=0.125”] : 652x(50/51)x2 = 1,278 lbf. (double shear configuration)
J4 [tmin=0.125”] : 652x(50/51)x2 = 1,278 lbf. (double shear configuration)
J5 [tmin=0.125”] : 652x(50/51) = 639 lbf.
J6 [tmin=0.0625”]: 492x(50/51) = 482 lbf.
It is noteworthy that the values in [MMPDS-15-Table 8.1.3.1.2(p)] are for Fsu=51 ksi, and the ultimate shear strength of the fastener material Fsu=50 ksi [MMPDS-15-Table 8.1.1.2]. Therefore, the joint’s shear strength was scaled down by a factor of 50/51.
Joint Bearing strength:
The joint bearing strength is determined based on the bearing strength of the thinnest sheet within the joint. In cases where multiple sheets share the same minimum thickness but are composed of different materials, the calculation will use the material with the lowest bearing strength among them. Hence, the joints’ ultimate bearing strength can be calculated as below [MMPDS-15-Table 8.1.2.1(a)]:
J3 [tmin=0.125”] : 1,606x(82/100) = 1,316 lbf. (Fbru=82 ksi for AL 6061-T6 Extrusion)
J4 [tmin=0.125”] : 1,606x(82/100) = 1,316 lbf. (Fbru=82 ksi for AL 6061-T6 Extrusion)
J5 [tmin=0.125”] : 1,606x(82/100) = 1,316 lbf. (Fbru=82 ksi for AL 6061-T6 Extrusion)
J6 [tmin=0.0625”]: 810x(125/100) = 1,012 lbf. (Fbru=125 ksi for AL 2024-T3 Sheet)
Since the Static Joint Strengths are smaller than the Joint Bearing Strength, the former will be considered as the joint allowable.
Rivet’s Tensile Strength:
The tensile strength value of ftu=285 lbf is based on 0.156” thick sheet [Technical Data Sheet-Cherrymax Rivets]. Therefore, the estimated tensile strengths at the aforementioned joints are as below:
J3 [tmin=0.125”] : 285x(0.125/0.156) = 228 lbf.
J4 [tmin=0.125”] : 285x(0.125/0.156) = 228 lbf.
J5 [tmin=0.125”] : 285x(0.125/0.156) = 228 lbf.
J6 [tmin=0.0625”]: 285x(0.0625/0.156) = 114 lbf.
MS20426AD Rivets
MS20426AD4 · BB4
Type Countersunk solid rivetMaterial AL 2117-T3Material Fsu 30 ksiSingle shear 389 lbfApplied joint J25
Rivet’s Shear Strength:
The MS20426AD4 rivets have a single shear strength value of 389 lbf [MMPDS-15-Table 8.1.2(b). MMPDS-15-Table 8.1.5(a), Analysis and Design of Flight Vehicle Structures-Bruhn-Table D1.7, Technical Data Sheet-NAS528 Fastener Codes.]. In order to take into account the reduction in rivet shear strength when it is inserted in a sheet, the Static Joint Strength is calculated, considering the CSK sheet thickness, as below:
J25 [tCSK=0.125”] : 532x(30/41) = 389 lbf.
It is noteworthy that the values in [MMPDS-15-Table 8.1.2.2(r)] are for Fsu=41 ksi, so the joint’s shear strength was scaled down by a factor of (30/41).
Joint Bearing strength:
Since the countersunk sheet is thicker than the non-countersunk sheet, calculating the Joint Bearing strength is required, and it will be done, using the non-countersunk sheet thickness, as below [MMPDS-15-Table 8.1.2.1(a)]:
J25 [tnon-countersunk=0.063”] : 810x(82/100) = 664 lbf. (Fbru=82 ksi for AL 6061-T6 Extrusion)
Since the Ultimate Shear Strength is smaller than the Joint Bearing Strength, the former will be considered as the joint allowable.
Rivet’s Tensile Strength:
The Ultimate Tensile Strength for 1/8” diameter AN426 (MS20426) Flush Head Rivet in 0.064” thick AL 2024 ALCLAD Sheet is 438 lbf [Page 952-Analysis & Design of Flight Vehicle Structures-Bruhn]. Hence, the tensile strength considering the thinnest sheet in the joint can be calculated as below:
J25 [tmin=0.063”] : 438x(0.063/0.064) = 431 lbf.
MS20470AD Rivets
MS20470AD4 · BJ4
Type Protruding solid rivetMaterial AL 2117-T3Material Fsu 30 ksiSingle shear 389 lbfApplied joints J11–J24
The MS20470AD rivets have a single shear strength value of 389 lbf [MMPDS-15-Table 8.1.2(b). MMPDS-15-Table 8.1.5(a), Analysis and Design of Flight Vehicle Structures-Bruhn-Table D1.7, Technical Data Sheet-NAS528 Fastener Codes].
Rivet’s Shear Strength:
The rivets in J11 and J13-J17 are in double shear state and have Dr/tmiddle value as below:
|
|
|
|
|---|---|---|---|
|
|
|
|
The rivets in J12 and J18-J24 are in double shear state and have Dr/tmin value as below:
|
|
|
|---|---|---|
|
|
|
|
|
The Dr/tmiddle in joints J13-J16 are greater than 1.5, Dr/tmin in joint J22 is greater than 3.0. Therefore, a correction factor, , needs to be calculated at these joints to compensate for the reduction in rivet shear strength resulting from high bearing stresses on the rivet in such cases. This factor can be calculated using the below formulas [MMPDS-15]:
J13 [tmiddle=0.05”] : α=1-0.13x(0.125/0.05 -1.5) = 0.870
J14 [tmiddle=0.025”] : α=1-0.13x(0.125/0.025 -1.5) = 0.545
J15 [tmiddle=0.05”] : α=1-0.13x(0.125/0.05 -1.5) = 0.870
J16 [tmiddle=0.025”] : α=1-0.13x(0.125/0.025 -1.5) = 0.545
J22 [tmin=0.04”] : α=1-0.04x(0.125/0.04 -3) = 0.995
Therefore, the ultimate shear strength at joints J11-J24 are as follows:
J11: 389x1x2 = 778 lbf. (double shear configuration)
J12: 389x1x1 = 389 lbf. (single shear configuration)
J13: 389x0.870x2 = 676 lbf. (double shear configuration)
J14: 389x0.545x2 = 424 lbf. (double shear configuration)
J15: 389x0.870x2 = 676 lbf. (double shear configuration)
J16: 389x0.545x2 = 424 lbf. (double shear configuration)
J17: 389x1x2 = 778 lbf. (double shear configuration)
J18: 389x1x1 = 389 lbf. (single shear configuration)
J19: 389x1x1 = 389 lbf. (single shear configuration)
J20: 389x1x1 = 389 lbf. (single shear configuration)
J21: 389x1x1 = 389 lbf. (single shear configuration)
J22: 389x1x1 = 389 lbf. (single shear configuration)
J23: 389x0.995x2 = 774 lbf. (double shear configuration)
J24: 389x1x1 = 389 lbf. (single shear configuration)
Joint Bearing strength:
The joint bearing strength is determined based on the bearing strength of the thinnest sheet within the joint. In cases where multiple sheets share the same minimum thickness but are composed of different materials, the calculation will use the material with the lowest bearing strength among them. Hence, the joints’ ultimate bearing strength can be calculated as below [MMPDS-15-Table 8.1.2.1(a)]:
J11 [tmin=0.063”] : 810x(82/100) = 664 lbf. (Fbru=82 ksi for AL 6061-T6 Extrusion)
J12 [tmin=0.125”] : 1,606x(82/100) = 1,316 lbf. (Fbru=125 ksi for AL 2024-T3 Sheet)
J13 [tmin=0.05”] : 642x(82/100) = 526 lbf. (Fbru=125 ksi for AL 2024-T3 Sheet)
J14 [tmin=0.025”] : 321x(82/100) = 263 lbf. (Fbru=125 ksi for AL 2024-T3 Sheet)
J15 [tmin=0.05”] : 642x(82/100) = 526 lbf. (Fbru=125 ksi for AL 2024-T3 Sheet)
J16 [tmin=0.025”] : 321x(82/100) = 263 lbf. (Fbru=125 ksi for AL 2024-T3 Sheet)
J17 [tmin=0.125”] : 1,606x(82/100) = 1,316 lbf. (Fbru=82 ksi for AL 6061-T6 Extrusion)
J18 [tmin=0.0625”]: 810x(82/100) = 664 lbf. (Fbru=125 ksi for AL 2024-T3 Sheet)
J19 [tmin=0.0625”]: 810x(82/100) = 664 lbf. (Fbru=125 ksi for AL 2024-T3 Sheet)
J20 [tmin=0.05”] : 642x(82/100) = 526 lbf. (Fbru=142 ksi for AL 7075-T62 Sheet)
J21 [tmin=0.0625”]: 810x(82/100) = 664 lbf. (Fbru=125 ksi for AL 2024-T3 Sheet)
J22 [tmin=0.04”] : 514x(82/100) = 421 lbf. (Fbru=142 ksi for AL 7075-T62 Sheet)
J23 [tmin=0.0625”]: 810x(82/100) = 664 lbf. (Fbru=125 ksi for AL 2024-T3 Sheet)
J24 [tmin=0.0625”]: 810x(82/100) = 664 lbf. (Fbru=125 ksi for AL 2024-T3 Sheet)
For joints J12, J17 through J22, and J24, the Static Joint Strengths are lower than the Joint Bearing Strengths; therefore, the Static Joint Strengths will govern and be used as the allowable values. Conversely, for joints J11, J13 through J16, and J23, the Joint Bearing Strengths are lower than the Static Joint Strengths, and thus will be used as the allowable values for those joints.
Rivet’s Tensile Strength:
The tensile strength considering the thinnest sheet in the joints can be calculated as below [Page 952-Analysis & Design of Flight Vehicle Structures-Bruhn]:
J11 [tmin=0.063”] : 495x(0.063/0.064) = 487 lbf.
J12 [tmin=0.125”] : 495 lbf. (For 0.072” thick sheet due to lack of data)
J13 [tmin=0.05”] : 471x(0.05/0.051) = 461 lbf.
J14 [tmin=0.025”] : 197 lbf.
J15 [tmin=0.05”] : 471x(0.05/0.051) = 461 lbf.
J16 [tmin=0.025”] : 197 lbf.
J17 [tmin=0.125”] : 495 lbf. (For 0.072” thick sheet due to lack of data)
J18 [tmin=0.0625”]: 495x(0.0625/0.064) = 483 lbf.
J19 [tmin=0.0625”]: 495x(0.0625/0.064) = 483 lbf.
J20 [tmin=0.05”] : 471x(0.05/0.051) = 461 lbf.
J21 [tmin=0.0625”]: 495x(0.0625/0.064) = 483 lbf.
J22 [tmin=0.04”] : 353 lbf.
J23 [tmin=0.0625”]: 495x(0.0625/0.064) = 483 lbf.
J24 [tmin=0.0625”]: 495x(0.0625/0.064) = 483 lbf.
MS24694 Screws
MS24694-S49
Type #10-32 countersunk screwThread UNF-3A · MIL-S-7742Diameter 0.19 inMaterial Cadmium-plated carbon steelFtu 125 ksiFsu 75 ksiApplied joints J28–J29
Screw’s Shank Shear Strength:
The Ultimate Single Shear Strength of the screw is fsu=2,125 lbf [MMPDS-15-Table 8.1.5(a)].
Joint Bearing strength:
The thinnest sheet in both joints is AL 2024-T351 Plate that has an ultimate bearing strength of 119 ksi (refer to the table below). Hence, the joints’ ultimate bearing strength is 1,197x(119/100)= 1,424 lbf [MMPDS-15-Table 8.1.5.1].
Since the Ultimate Shear Strength is greater than the Joint Bearing Strength, the later will be considered as the joint allowable.
Screw’s Tensile Strength:
Ultimate Tensile Strength of the screw is ftu=2,500 lbf [Technical Data Sheet-MS24694].
AN3 and AN4 Bolts
AN3 / AN4 Aircraft Bolt
Thread 1/4-28 UNF-3ADiameter 0.25 inMaterial Non-corrosion-resistant steelUltimate shear 3,680 lbfUltimate tension 4,080 lbfApplied joint J30
Screw’s Shank Shear Strength
The Ultimate Shear Strength for the bolt is 3,680 lbf [Technical Data Sheet-NASM3-20].
Joint Bearing strength
The thinnest sheet in joint J30 is AL 2024-T3 Sheet that has an ultimate bearing strength of 125 ksi (refer to the table below). Hence, the joints’ ultimate bearing strength is 1,575x(125/100)= 1,968 lbf [MMPDS-15-Table 8.1.5.1]. Since the Ultimate Shear Strength is bigger than the Joint Bearing Strength, the later will be considered as the joint allowable.
Screw’s Tensile Strength:
The Ultimate Tensile Strength for the bolt is 4,080 lbf [Technical Data Sheet-NASM3-20].
FE200744 Stud and Lock Fitting
FE200744 Stud + Lock Fitting
Thread 3/8-24 UNRFDiameter / length 0.375 / 0.9 inMaterial Zinc-plated carbon steelTrack shear 4,200 lbfTrack tension 5,700 lbfApplied joints J1–J2
Stud’s Shear Strength:
The FE200744 fitting has an Ultimate Shear Strength of 4,200 lbf when it is utilized in the aforementioned track [Technical Data Sheet-FE200744].
Joint Bearing strength:
The studs of the FE200744 fittings are utilized in joints J1 and J2, and it bears with 0.25” thick AL 6061-T6511 Extrusion that has an ultimate bearing strength of 69 ksi (refer to the table below). Hence, the joints’ ultimate bearing strength can be calculated as fbru=Fbru x Abr = 69,000 x 3/8” x 0.25” = 6,468 lbf.
Since the Ultimate Shear Strength is less than the Joint Bearing Strength, the former will be considered as the joints’ shear allowable.
Screw’s Tensile Strength:
The FE200744 fitting has an Ultimate Tensile Strength of 5,700 lbf when it is utilized in the aforementioned track [Technical Data Sheet-FE200744].
The Heavy Duty Anodized Aircraft Track has a vertical load allowable of 6,000 lbf [Technical Data Sheet-ANCRA Aircraft Track]. This represents the allowable reaction force exerted on the rail lip by the FE200744 stud head.
Since the Ultimate Tensile Strength of the FE200744 fitting is less than the Ultimate Tensile Strength of the rail, the former will be considered as the joints’ tensile allowable.
Summary of the Fasteners Allowables
Summary of the utilized Fasteners Allowables
| Joint No. | LOCATION | Shear Strength [lbf] |
Bearing strength [lbf] |
Tensile Strength [lbf] |
Selected Joint Shear Allowable [lbf] |
|---|---|---|---|---|---|
| ANCRA Single Stud Fitting (P/N 49184-10) that consists of a stud and a lock (P/N FE200744). | |||||
| J1 | Point 1 | 4,200 | 6,468 | 5,700 | 4,200 |
| J2 | Point 2 | 4,200 | 6,468 | 5,700 | 4,200 |
| ARN/4N (CR3213) Rivets | |||||
| J3 | Point 1 | 1,278 | 1,316 | 228 | 1,278 |
| J4 | Point 2 | 1,278 | 1,316 | 228 | 1,278 |
| J5 | Points 5 and 9 | 639 | 1,316 | 228 | 639 |
| J6 | Avionics Box | 482 | 1,012 | 114 | 482 |
| ARM/4 (CR3212) Rivets | |||||
| J7 | Point 1 | 786 | N/R | 115 | 786 |
| J8 | Point 1 | 582 | N/R | 228 | 582 |
| J9 | Point 2 | 582 | N/R | 228 | 582 |
| J10 | AFT and Outboard Panels | 428 | N/R | 129 | 428 |
| BJ/4N (MS20470AD4) Rivets | |||||
| J11 | Point 1 | 778 | 664 | 487 | 664 |
| J12 | Point 2 | 389 | 1,316 | 495 | 389 |
| J13 | Point 1 | 676 | 526 | 461 | 526 |
| J14 | Point 1 | 424 | 263 | 197 | 263 |
| J15 | Point 2 | 676 | 526 | 461 | 526 |
| J16 | Point 2 | 424 | 263 | 197 | 263 |
| J17 | Points 5 and 9 | 389 | 1,316 | 495 | 778 |
| J18 | Supporting Structure | 389 | 664 | 483 | 389 |
| J19 | Supporting Structure | 389 | 664 | 483 | 389 |
| J20 | Supporting Structure | 389 | 526 | 461 | 389 |
| J21 | Supporting Structure | 389 | 664 | 483 | 389 |
| J22 | Supporting Structure | 389 | 421 | 353 | 389 |
| J23 | Supporting Structure | 774 | 664 | 483 | 664 |
| J24 | Supporting Structure | 389 | 664 | 483 | 389 |
| BB/4N (MS20426AD4) Rivets | |||||
| J25 | Point 1 | 389 | 664 | 431 | 389 |
| NAS8603-12 CSK screws | |||||
| J26 | Point 1 | 2,690 | 981 | 2,975 | 981 |
| J27 | Point 2 | 2,690 | 981 | 2,975 | 981 |
| MS24694-S49 CSK Screws and MS21209F1-15P Helicoils | |||||
| J28 | Point 1 | 2,125 | 1,424 | 2,500 | 1,424 |
| J29 | Point 2 | 2,125 | 1,424 | 2,500 | 1,424 |
| AN4-11A Bolts and NAS1834-4-500 Inserts | |||||
| J30 | Points 6, 7, and 8 | 3,680 | 1,968 | 4,080 | 1,968 |
LOAD CASES FORMULATION
Interior installation → evaluate both flight and emergency conditions.
The governing directional case is selected by comparing the worst flight acceleration with the equivalent limit form of the emergency-landing requirement.
REGULATORY SOURCE BASISFAR Part 25 criteria used to formulate the structural load envelope
Flight-load framework
FAR 25.321 and 25.331–25.351
- General flight loads and symmetric maneuver response
- Flight maneuver envelope and design airspeeds
- Limit maneuver factors, gust and turbulence loads
- Fuel/oil, high-lift, rolling and yaw conditions
Emergency landing
FAR 25.561
- Forward: 9 g
- Downward: 6 g
- Upward: 3 g
- Sideward: 3 g airframe / 4 g seats & attachments
- Rearward: 1.5 g
The rack center is taken at X563.58. Directional flight accelerations are obtained from the DHC-8-100 load-case charts and interpolated at the rack station before comparison with the emergency-landing envelope.
Limit load values () for the governing flight conditions in all load directions.
Load Direction |
X558.00 [g] |
X572.00 [g] |
X563.58 [g] |
|---|---|---|---|
| Upward | 5.87 | 6.04 | 5.92 |
| Downward | -6.24 | -6.35 | -6.27 |
| Starboard or Outboard | 1.80 | 1.87 | 1.82 |
| Port or Inboard | -1.80 | -1.87 | -1.82 |
| Forward | -0.63 | -0.57 | -0.61 |
| AFT | 0.18 | 0.11 | 0.16 |
It is noteworthy that the acceleration values at X563.58 were estimated using linear interpolation.
These are the limit loads values. However, the ultimate load values must be used for the static stress analysis purposes. The ultimate load values () can be obtained by multiplying the limit load values by 1.5. Alternatively, a factor of 1.5 will be utilized in calculating the safety margins later in this report.
The limit load cases that the Air Conditioning Rack Installation will be checked against are listed in the table below:
Governing limit-load cases applied to the FEM.
| Case | Direction | Flight limit [g] |
Emergency equivalent [g] |
Applied [g] |
Governing basis |
|---|---|---|---|---|---|
| 1 | Upward | 5.92 | 2.00 | 5.92 | Flight |
| 2 | Downward | -6.27 | -4.00 | -6.27 | Flight |
| 3 | Outboard | 1.82 | 2.00 | 2.00 | Emergency landing |
| 4 | Inboard | -1.82 | -2.00 | -2.00 | Emergency landing |
| 5 | Forward | -0.61 | -6.00 | -6.00 | Emergency landing |
| - | Aft | 0.16 | 1.00 | Not separately required | Covered conservatively by Forward case |
I compared flight and emergency conditions direction by direction and retained only the larger absolute limit acceleration. This prevented duplicate cases while preserving the governing regulatory demand. The FEM therefore contained five clearly traceable load cases rather than separate, overlapping flight and emergency models.
FINITE ELEMENT MODEL (FEM)
Air Conditioning Rack Model
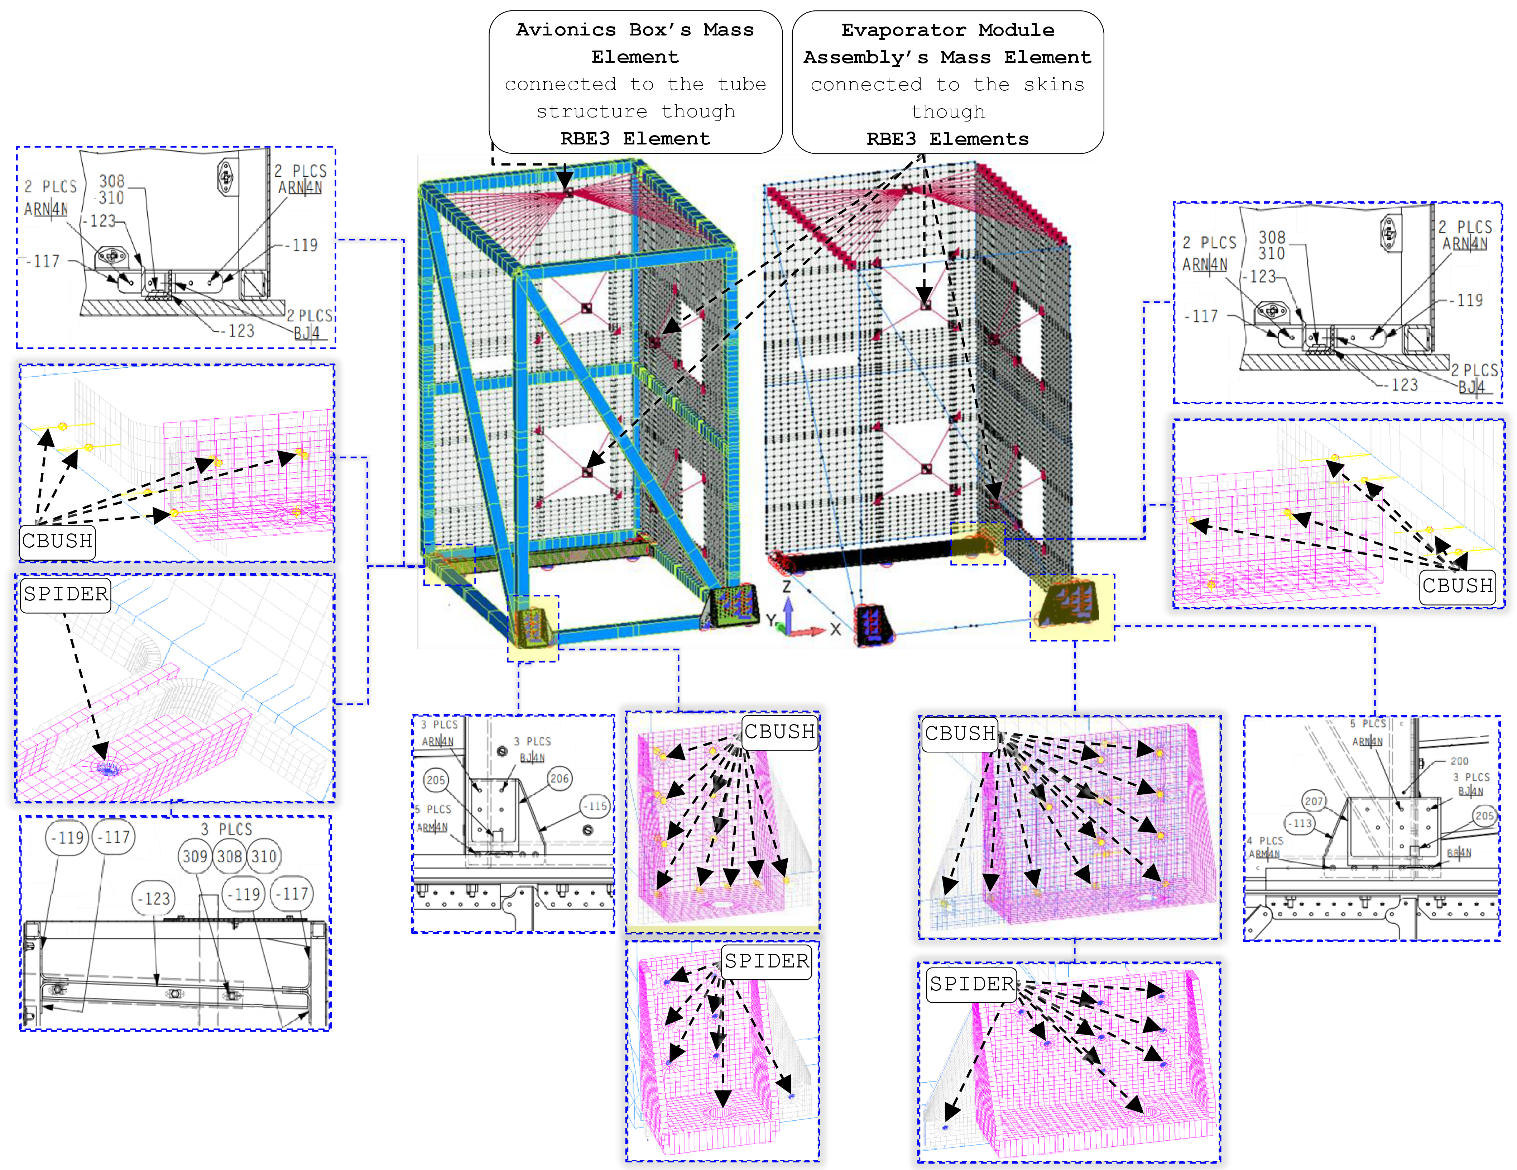
Non-structural detail is omitted geometrically, not inertially.
Exterior removable panels and small hardware are excluded from the mesh; their equivalent weight is distributed over the tube structure as NSM.
Beam · tube structure
The welded square-tube frame is modeled with beam elements so section area, inertia, axial force, shear and bending are recovered efficiently along the primary load path.
Plate · skins, gussets & brackets
Six material/thickness plate properties represent the aft/outboard skins, gussets, base clips, gusset/attachment angles and rack-mount fittings. The thin-walled parts are governed by membrane and bending response rather than through-thickness stress.
CBUSH · mounting fasteners
Rack-mount, base-clip and attachment-angle fasteners use 1×10⁹ lbf/in translational stiffness with free rotations. This transfers shear/tension without imposing artificial rotational fixity.
RBE2 · fastener-hole spiders
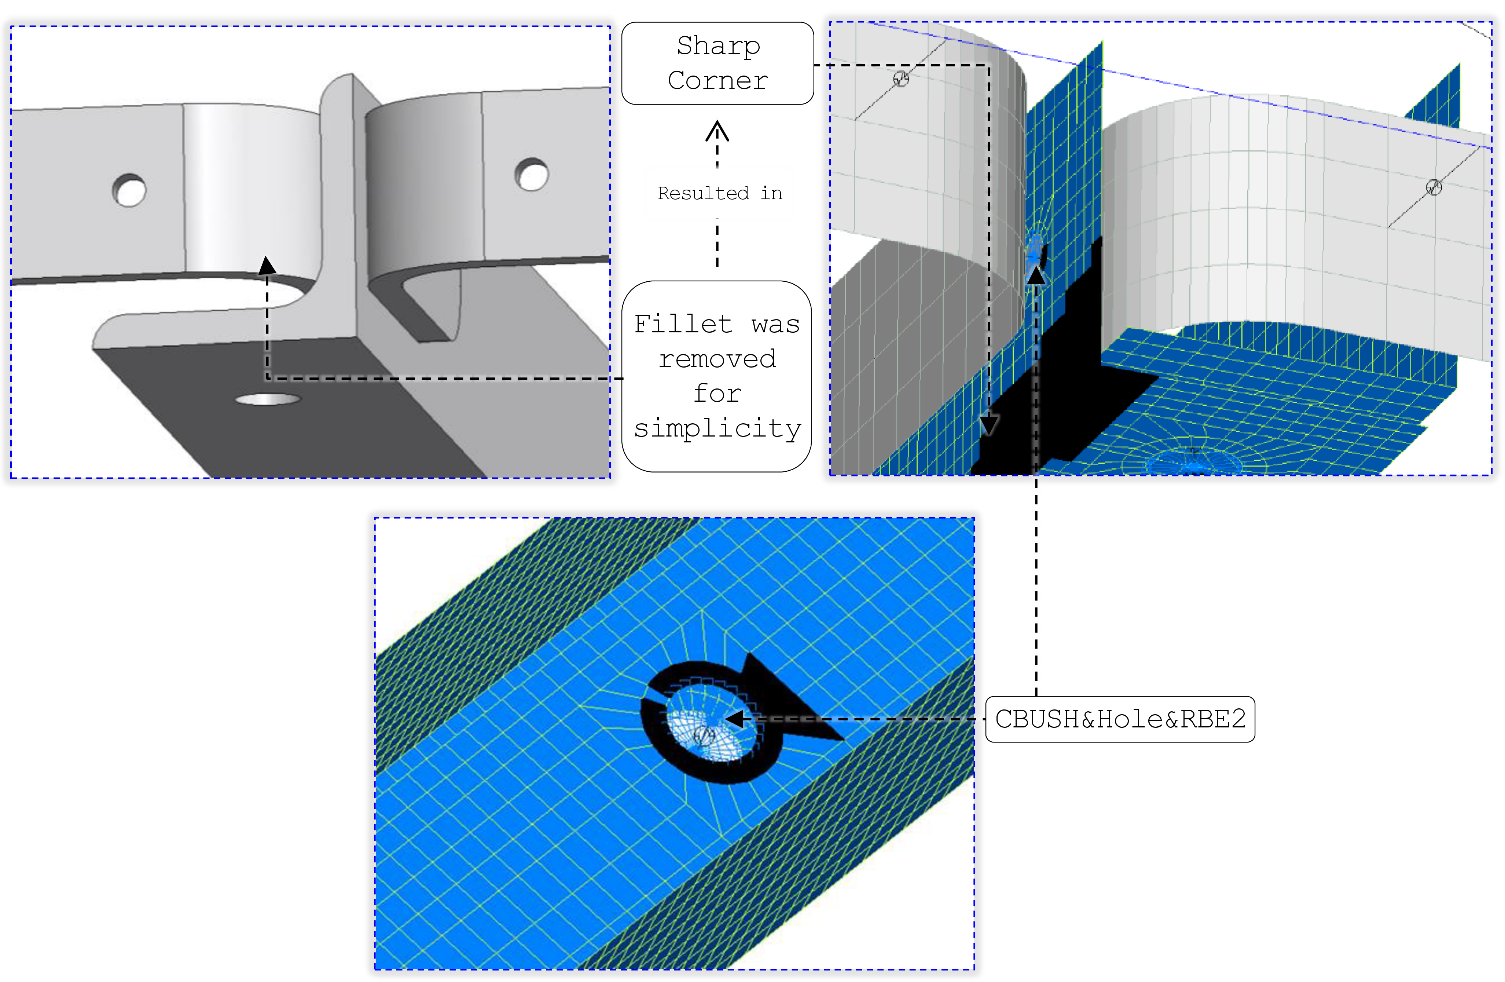
Modeled attachment holes use RBE2 spiders to distribute connector reactions over the hole perimeter. Non-governing holes are suppressed to avoid artificial local stress peaks that do not control the primary load path.
RBE3 · equipment masses
The four evaporator modules and avionics box are introduced as point masses through RBE3 elements, transferring inertia to the structure without adding rigid-body stiffness.
Glued vs. non-penetrating interfaces
Opposing attachment-angle faces are glued where full transfer is intended; rack-fitting/gusset and skin interfaces use non-penetrating contact so compression is transferred without unrealistically bonding every interface.
Loads and Constraints
As illustrated previously, five cases are to be examined. These cases were examined through FEMAP by utilizing body limit loads in the direction of each case.
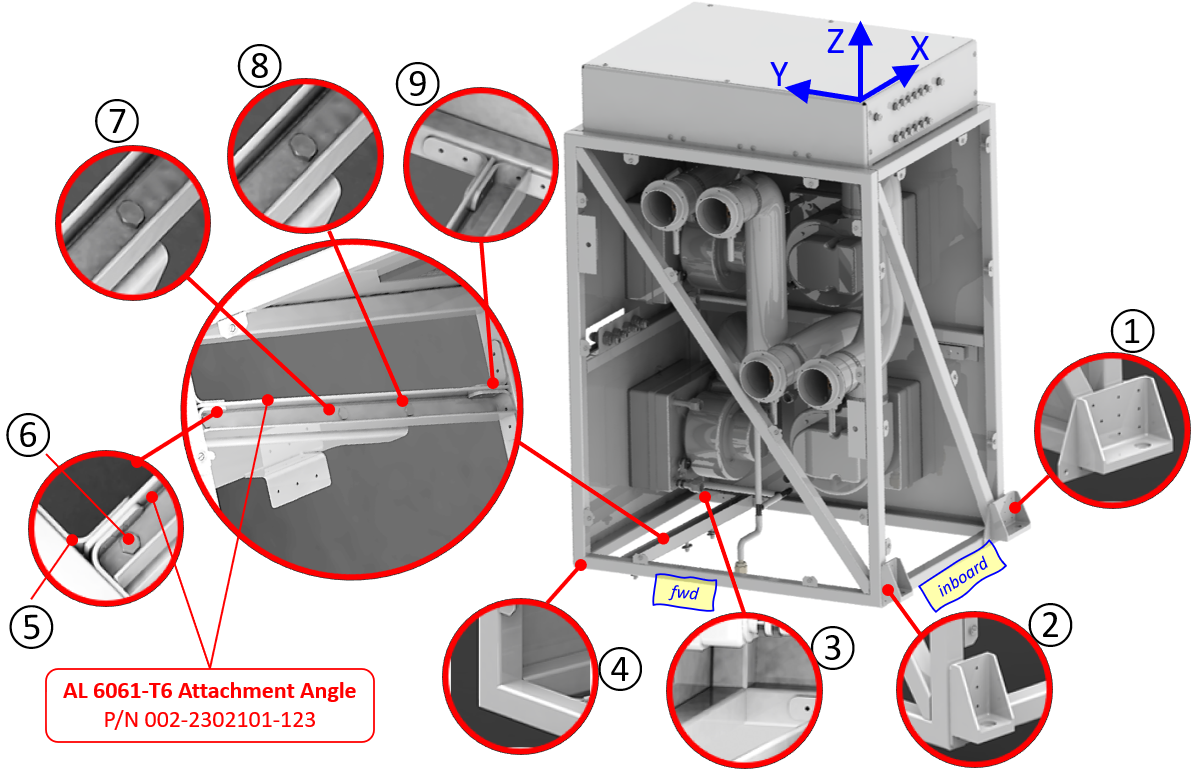
As shown in the above figure, the boundary conditions for the static stress analysis were applied to the following nodes:
Node ①: AFT Inboard node.
Node ②: FWD Inboard node.
Node ③: AFT Outboard corner node.
Node ④: FWD Outboard corner node.
Node ⑥: FWD node at the attachment angle.
Node ⑦: Center node at the attachment angle.
Node ⑧: AFT node at the attachment angle.
The restrained degrees of freedom (DoFs) at each of the previous nodes varies per the load case. This ensures that the model accurately simulates the real-world constraints experienced by the Air Conditioning Rack. The table below lists the DoFs restrained at each node for each load case.
The restrained degrees of freedom (DoFs) at each Attachment Points for each load case.
| FWD | Inboard | Outboard | Upward | Downward | |
|---|---|---|---|---|---|
| ① | TxTyTz | TxTyTz | TxTyTz | TxTyTz | TxTyTz |
| ② | TxTyTz | TxTyTz | TxTyTz | TxTyTz | TxTyTz |
| ③ | Free | Free | Tz | Free | Tz |
| ④ | Tz | Free | Tz | Free | Tz |
| ⑥ | TxTyTz | TxTyTz | TxTyTz | TxTyTz | TxTyTz |
| ⑦ | TxTyTz | TxTyTz | TxTyTz | TxTyTz | TxTyTz |
| ⑧ | TxTyTz | TxTyTz | TxTyTz | TxTyTz | TxTyTz |
For the “FWD” loading case, point ③ has no upward restraint capability
For the “Inboard” loading case, points ③ and ④ have no upward restraint capability
For the “Upward” load case, points ③ and ④ have no upward restraint capability.
Air Conditioning Rack’s Supporting Structure Model
Beam · seat tracks / blocks / T-section
These members are represented by beam properties because axial and bending response is governed primarily by section properties; solid modeling would add cost without improving the global load-path solution.
Grounded CBUSH · existing structure
Grounded connectors at the pre-existing T-section track represent the restraint delivered by adjacent webs, stiffeners and frames while avoiding a need to model the entire surrounding fuselage.
CBUSH · seat-track screws
MS24694-S49 and NAS8603-12 screws use high translational stiffness with free rotations. The connector captures global shear/tension transfer without introducing detailed bolt contact and thread geometry.
RBE2 · track end coupling
Seat-track end points rigidly transfer the selected Ty and Rx motions into the T-section support path, reproducing the constrained interface behavior without over-modeling the surrounding airframe.
Plate · intercostal / doubler / clips / brace
Thin structural sheet components are modeled with plate elements to recover membrane, bending and shear response directly. Through-thickness solid stress is non-governing for the global substantiation.
Directional CBUSH stiffness
MS20470AD4 rivets use 1×10⁹ lbf/in in shear and 1×10⁵ lbf/in in tension with free rotations, reflecting a shear-dominant riveted joint without artificially rigid tensile restraint.
Physical interfaces retained
Non-penetrating contact allows compression and relative interface motion where appropriate; glued contact is used only where the assembly is intended to transfer load continuously.
RBE2 spider · outboard attachment
Concentrated rack reactions are distributed around the fastener-hole perimeter to suppress node singularities and provide a stable, physically meaningful load introduction into the sheet structure.
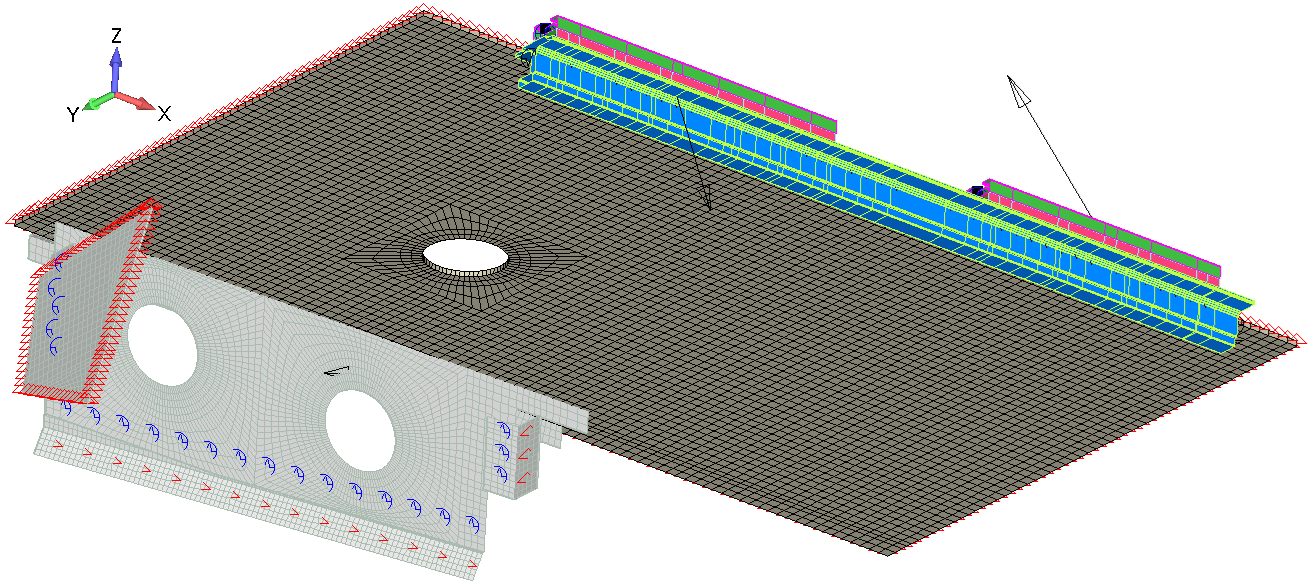
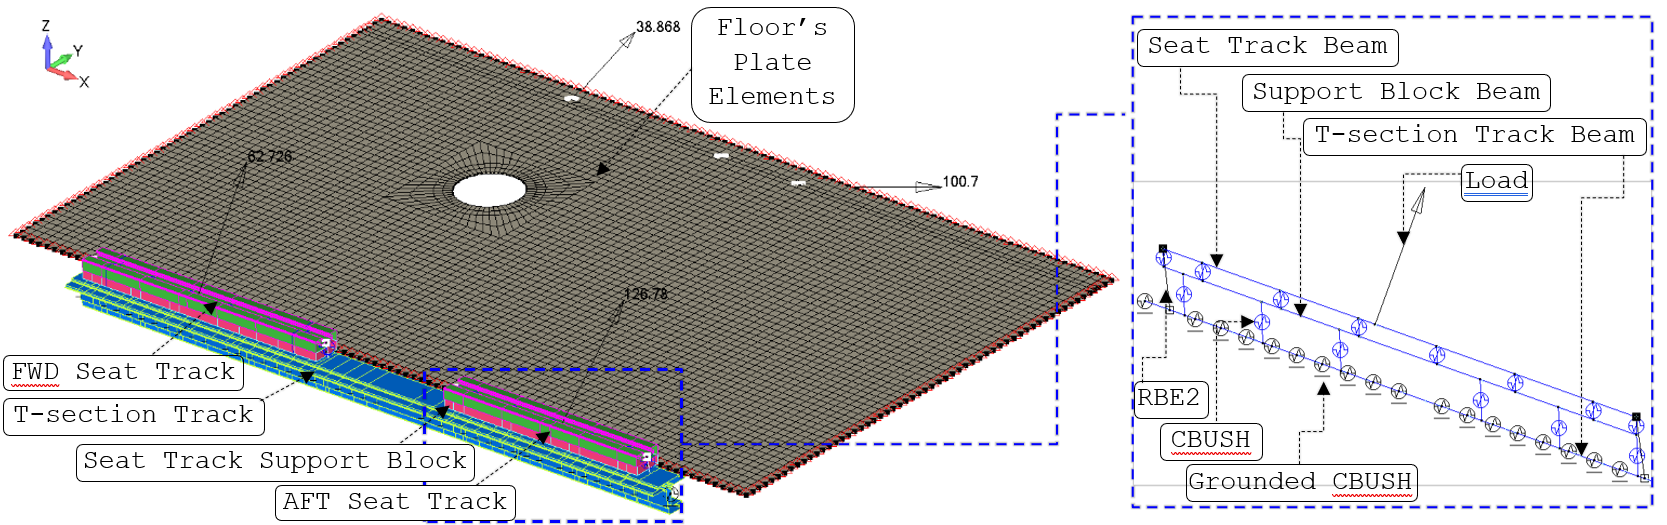
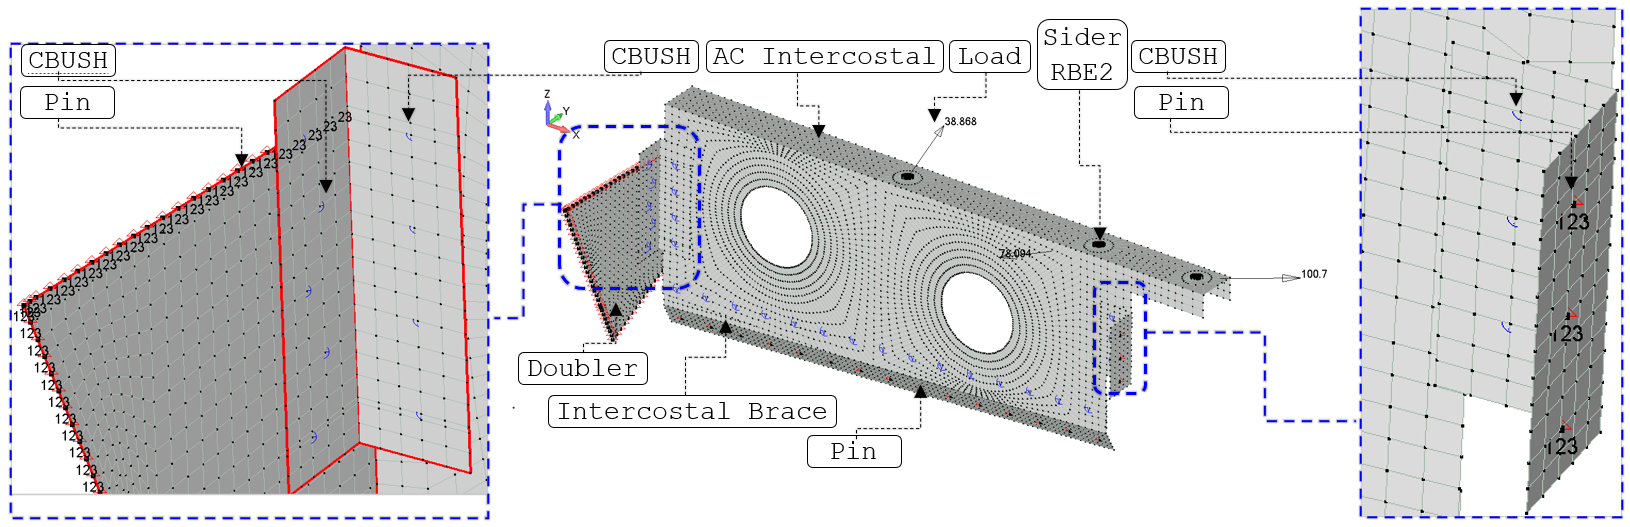
Equivalent floor-panel idealization. The sandwich floor is represented by an equivalent plate that preserves the required global flexural rigidity and distributed-load transfer. This is appropriate for rack-support substantiation; local core crushing and face-sheet delamination are outside the scope of the global plate idealization.
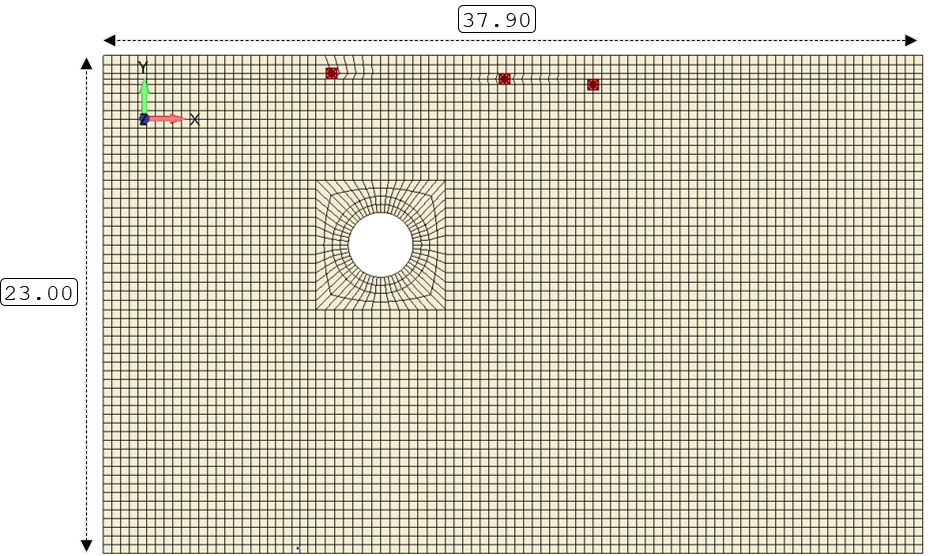
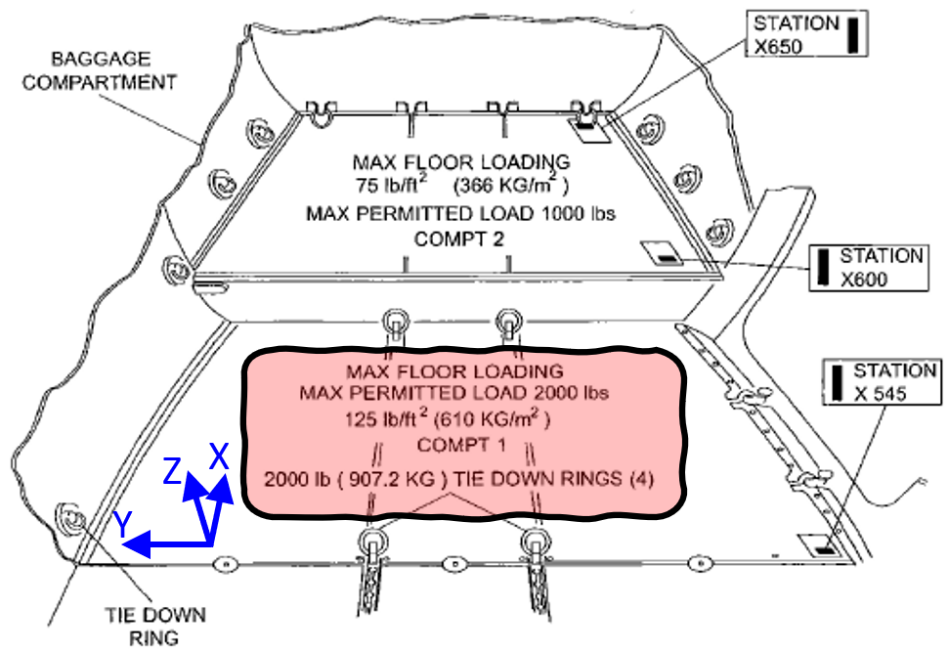
The sandwich floor is represented by a homogeneous AL 2024-T3 CLAD plate for the global support-model analysis. The source model preserves the required global bending/load-transfer response while excluding local sandwich failure modes such as core crushing and face-sheet delamination.
The equivalent plate is checked against the cargo-floor downward limit demand:
For a simply supported rectangular plate under uniform pressure, the maximum bending stress is:
β - plate coefficientb - smaller panel dimensiont - equivalent plate thicknessq - uniform pressure
Using , the minimum required thickness becomes:
For a 37.90 in × 23.00 in panel, . Linear interpolation of the source plate coefficient gives:
With , the source check gives:
✓The equivalent-plate idealization is therefore supported by a 0.189 in minimum-thickness check for the stated cargo-floor limit demand.
Method basis: [Formulas for Stress & Strain-Raymond Roark-Table 11.4] and [MMPDS-15-Table 3.2.4.0(c1)].
Loads and Constraints
Five load cases were analyzed on the Main Air Conditioning Rack model using FEMAP, with body limit loads applied in the direction corresponding to each case. The resulting reaction forces at the attachment points of the air conditioning rack, obtained from each load case, were then extracted and used as applied loads at the corresponding locations in the model of the rack’s supporting structure. This approach ensures load path consistency between the primary rack and its supporting structure.
The translational DoFs (TxTyTz) were restrained at the following locations:
All Nodes at the Floor Edges.
All Nodes at the Doubler Edges.
Three Nodes at the AFT Side of the AFT Clip.
Fifteen Nodes at the Bottom Side of the Intercostal Brace.
Analysis
Linear static response is appropriate for the defined ultimate/limit load cases and the global strength checks performed here.
Member forces, plate stresses, connector reactions and constraint forces are recovered for downstream hand checks and margins.
WTMASS enabled
Mass is entered in lbm, density in lbm/in³ and acceleration in in/s². WTMASS provides consistent mass-to-force conversion so solver forces are recovered in lbf and stresses in psi.
FEA RESULTS
Beams
Tube Structure
the figure below provides a cross-sectional view of a tube weld, where the weld extends 1/16” outward from the tube's surface and penetrates inward by 1/32”. The estimation of stress within the welds assumes a conservative methodology, accounting for stress redistribution across the weld section. This approach ensures that the evaluation of the weld's structural integrity remains on the safe side by considering potential stress concentrations and the redistribution that occurs in the surrounding material.
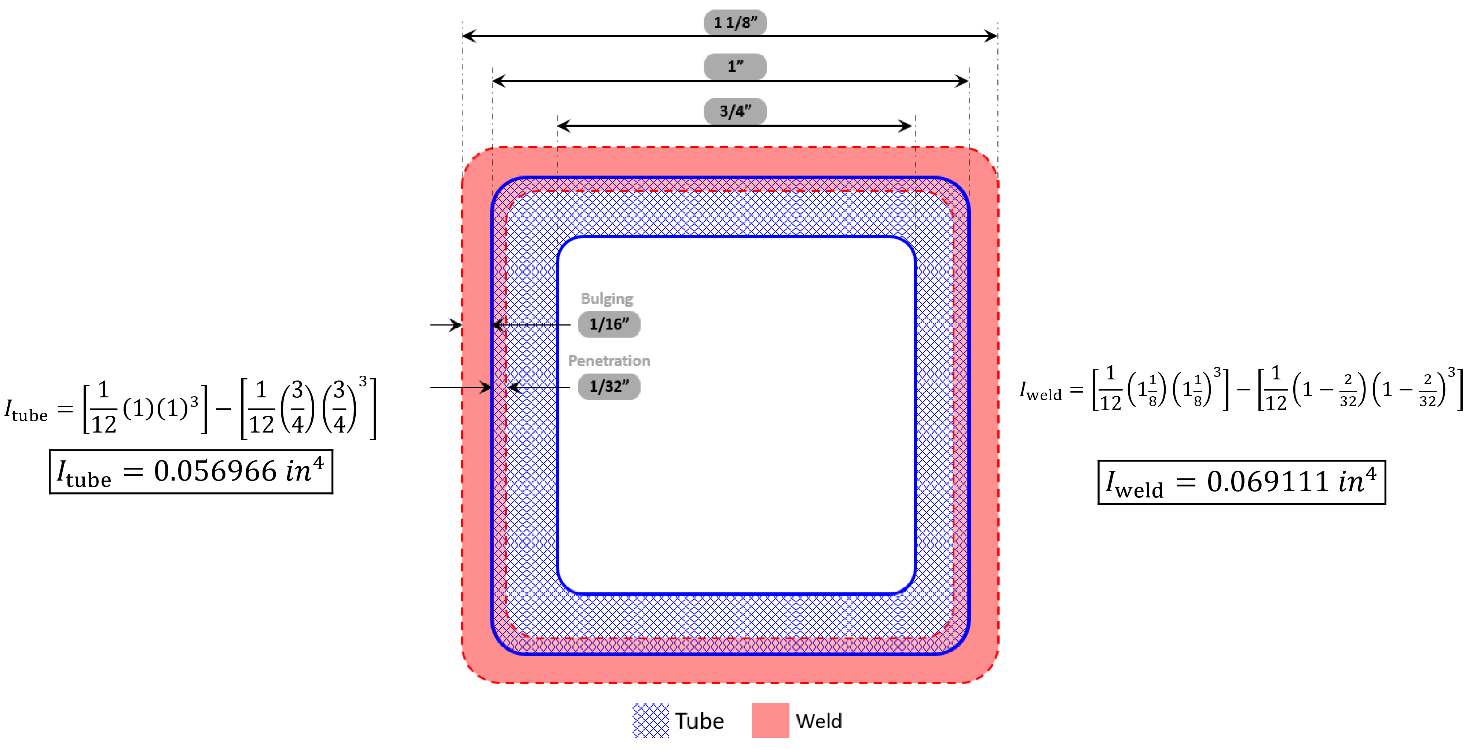
Weld stress treatment. Tube member forces are recovered from the beam model, then converted to weld-section stresses using the actual weld/tube section-property ratios. This avoids modeling weld beads with solid elements while retaining the conservative change in area and bending section modulus.
For a given bending moment (), the ratio of weld bending stress () to the tube bending stress () can be calculated as follows:
Hence, the weld bending stress () can be expressed as follows:
For a given axial load (), the ratio of weld axial stress () to the tube axial stress () can be calculated as follows:
Hence, the weld axial stress () can be expressed as follows:
The table below lists the maximum Axial Force and Bending Moments values for each load case within the tube structure. As shown in the figure below, the global maximum values occur at different locations. Therefore, the tensile and compressive combined stresses (due to axial and bending moments loads) were calculated for each element within the tube structure using excel sheet.
The Maximum Axial Force and Bending Moments values for each load case. The highlighted values are the global maximum values. The results are due to applied limit loads.
| FWD | INBOARD | OUTBOARD | UPWARD | DOWNWARD | |
|---|---|---|---|---|---|
| M1 [in-lbf] | 599.91 | 78.78 | -54.30 | 168.86 | 75.59 |
| M2 [in-lbf] | 357.98 | -232.82 | -52.71 | -559.06 | 136.81 |
| Axial [lbf] | 420.84 | -87.34 | 69.40 | 146.70 | -144.33 |
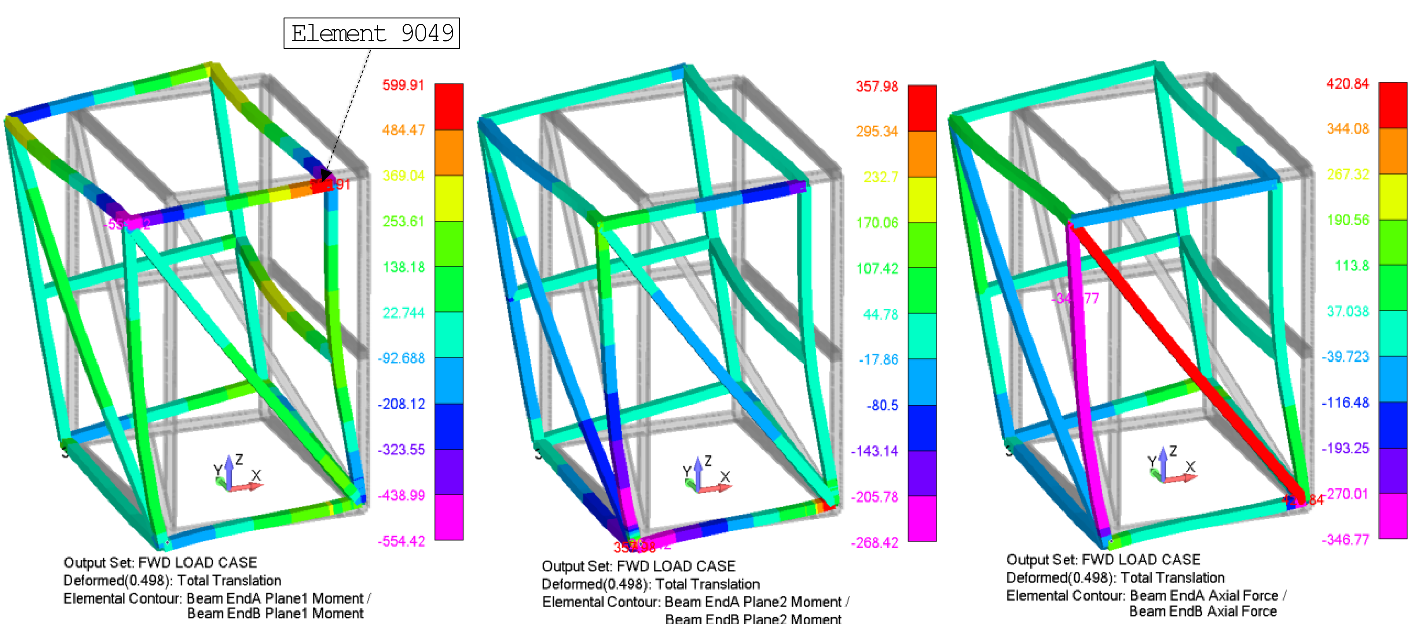
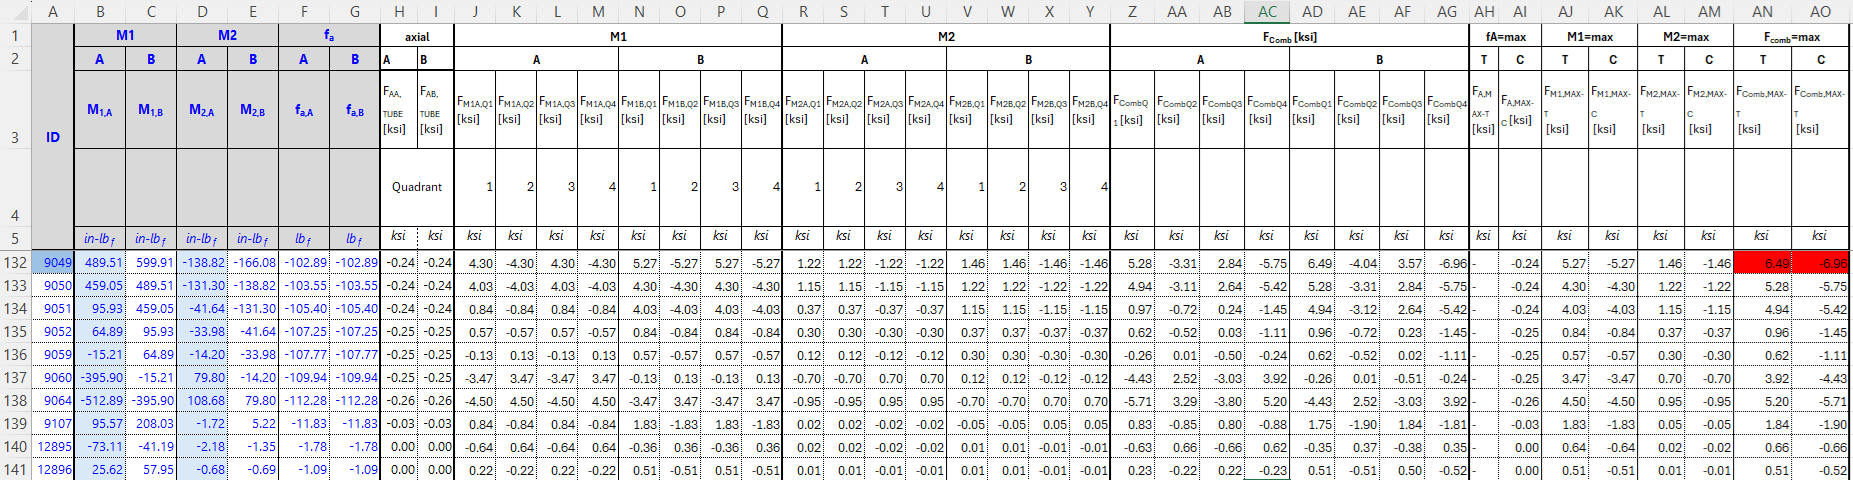
As shown in the above figure, the maximum tensile and compressive combined stresses occur at element No. 9049 and they belong to the forward load case. The stress calculations at Element No. 9049 are as follows:
The axial and bending stresses at the tubes:
Therefore, the global maximum axial and bending stresses at the welds can be estimated as below:
Hence, the maximum tensile and compression combined stresses on the tubes can be calculated as below (the bold values are the global maximums):
Hence, the maximum tensile and compression combined stresses on the welds can be calculated as below (the bold values are the global maximums):
The tube structure is fabricated from 1”x1”x0.125” AL 6061-T6 extrusion. This material selection is noted for its high Ultimate Tensile Stress value of (refer to the table below), and its Compression Yield Stress value is . Adjacent to the weld areas, Ultimate Tensile Stress and the Compression Yield Stress values are and , respectively [Table 2-19W, Aluminum Design Manual 2010]. This reduction in strength accounts for the weakening effects of welding, which includes alterations in microstructure and potential introduction of stress concentrators. Therefore, the margin of safety in the Tube Structure can be computed as below:
→ PASS
Column-Buckling allowable:
The column buckling allowable can be expressed as below:
Where, K is the buckling coefficient. Ec is the compressive modulus of elasticity of the material. I is the minimum moment of inertia of the column. L is the total length of column.
Since the tubes are welded and we are considering bending at the welds they are closer to fixed supports. A reasonable approximation would be to calculate the column allowable for the fixed-fixed case (K=4) as well as the pinned-pinned (K=1) case, then the average of the resulted critical values will be our benchmark.
The most critical beam in the tube structure has a length of 40 in. Which is the longest beam in the tube structure that is only fixed at its ends. Therefore, the critical buckling stresses can be calculated as below:
As previously shown, the maximum compressive combined stress is and it occurs at the tubes. Therefore, the margin of safety in the Tube Structure can be computed as below:
→ PASS
Flange Crippling
Crippling is a mode of failure that occurs due to compression effects. Typically, this is a check that is applied to thin-walled columns where the local stability of the cross section may not allow the column to achieve its full column strength.
To calculate the Crippling Allowable of the Tube Structure, Needham and Gerard Method is used. Needham's method divides the structural section into angle elements whose individual crippling strengths are determined experimentally and summed to obtain the total section strength. Instead of determining crippling strengths experimentally, semi-empirical equations were used as proposed in the relevant discussion in [Stress Analysis Manual-Air Force Flight Dynamics Laboratory-Wright-Patterson]. Moreover, the tube structure cross-section is modified, as shown below to simplify the analysis.
| Angle # | h | th | b | tb | An | Ce | Fccn | AnFccn |
|---|---|---|---|---|---|---|---|---|
| 1 | 0.500 | 0.125 | 0.500 | 0.125 | 0.125 | 0.366 | 75.075 | 9.384 |
| 2 | 0.500 | 0.125 | 0.500 | 0.125 | 0.125 | 0.366 | 75.075 | 9.384 |
| 3 | 0.500 | 0.125 | 0.500 | 0.125 | 0.125 | 0.366 | 75.075 | 9.384 |
| 4 | 0.500 | 0.125 | 0.500 | 0.125 | 0.125 | 0.366 | 75.075 | 9.384 |
| Σ | 0.500 | 37.537 | ||||||
FCrippling [ksi] |
75.07 |
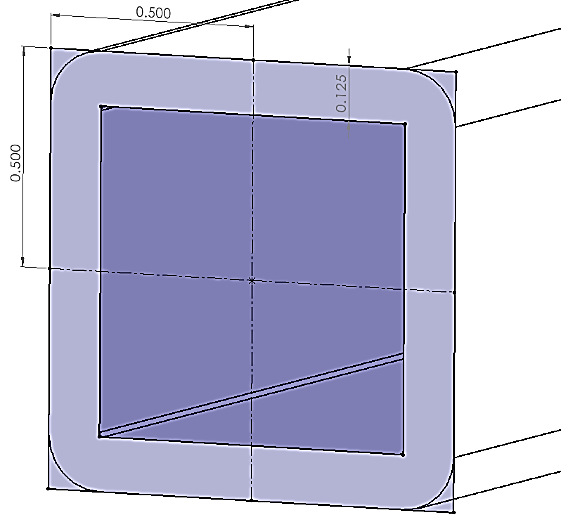
Ce=0.316 for 2-edges free, 0.342 for 1-edge free, and 0.366 for no edge free. Fccn is expressed below:
Where: h and b are the angle’s height and width, respectively. tmin is the minimum thickness in the angle. Fcy is Material compressive yield Strength. E is Material young’s modulus
As previously shown, the maximum compressive combined stress is and it occurs at the tubes. Therefore, the Tube Structure passes by observation against crippling.
Structural Sheet Metals in the Air Conditioning Rack Assembly
In this section, the structural sheet metals will be assessed based on the maximum tensile and compressive principal stresses. The maximum tensile principal stress will be checked against the allowable ultimate tensile strength (Ftu) of the material. On the other hand, the maximum compressive principal stress will be checked against the allowable yield compressive strength (Fcy) of the material. The maximum principal stress (F1) and the minimum principal stress (F2) on both sides of the plates were reviewed for all cases, and it is summarized in the below table
Maximum and Minimum Principal Stresses for the Structural Sheet Metals. The highlighted cells represent the global maximum tensile and compressive principal stresses. The results are due to applied limit loads.
2024-T3 ALCLAD Sheet [t=0.063” – 0.128”] |
FWD | UP | DOWN | IN | OUT | MAX Tension [ksi] |
MAX Compression [ksi] |
||||||
|---|---|---|---|---|---|---|---|---|---|---|---|---|---|
| F1 [ksi] |
F2 [ksi] |
F1 [ksi] |
F2 [ksi] |
F1 [ksi] |
F2 [ksi] |
F1 [ksi] |
F2 [ksi] |
F1 [ksi] |
F2 [ksi] |
||||
| Top | Tension | 53.00 | 16.08 | 30.68 | 11.86 | 31.70 | 12.91 | 12.05 | 3.95 | 11.30 | 3.95 | 77.15 | 95.23 |
| Compression | 33.03 | 95.23 | 15.35 | 37.95 | 12.59 | 31.91 | 6.12 | 13.36 | 3.96 | 11.25 | |||
| Bot | Tension | 77.15 | 32.98 | 39.10 | 13.00 | 32.38 | 12.54 | 15.53 | 5.14 | 11.63 | 4.26 | ||
| Compression | 15.50 | 45.03 | 11.85 | 39.73 | 12.94 | 32.06 | 4.31 | 15.57 | 4.20 | 11.60 | |||
AL 6061-T6 and T6511 Extrusion [t ≤ 1”] |
FWD | UP | DOWN | IN | OUT | MAX Tension [ksi] |
MAX Compression [ksi] |
||||||
| F1 [ksi] |
F2 [ksi] |
F1 [ksi] |
F2 [ksi] |
F1 [ksi] |
F2 [ksi] |
F1 [ksi] |
F2 [ksi] |
F1 [ksi] |
F2 [ksi] |
||||
| Top | Tension | 21.22 | 10.43 | 39.16 | 11.07 | 10.34 | 3.17 | 15.61 | 4.41 | 4.55 | 2.23 | 39.16 | 37.05 |
| Compression | 7.30 | 37.05 | 12.48 | 35.86 | 1.47 | 8.66 | 4.96 | 14.66 | 1.71 | 4.33 | |||
| Bot | Tension | 27.22 | 4.21 | 12.95 | 1.98 | 7.41 | 1.85 | 5.13 | 1.87 | 5.30 | 1.56 | ||
| Compression | 9.63 | 22.36 | 3.79 | 15.47 | 1.13 | 11.50 | 2.79 | 7.52 | 1.97 | 3.69 | |||
AL 6061-T6 and T6511 Extrusion [t=1.001” – 6.5”] |
FWD | UP | DOWN | IN | OUT | MAX Tension [ksi] |
MAX Compression [ksi] |
||||||
| F1 [ksi] |
F2 [ksi] |
F1 [ksi] |
F2 [ksi] |
F1 [ksi] |
F2 [ksi] |
F1 [ksi] |
F2 [ksi] |
F1 [ksi] |
F2 [ksi] |
||||
| Top | Tension | 23.47 | 8.27 | 8.27 | 2.69 | 6.33 | 2.22 | 3.38 | 1.22 | 6.60 | 2.50 | 23.47 | 23.05 |
| Compression | 5.55 | 19.83 | 2.90 | 4.85 | 2.49 | 5.05 | 1.11 | 3.74 | 2.18 | 6.18 | |||
| Bot | Tension | 20.57 | 7.54 | 6.17 | 2.75 | 5.02 | 1.81 | 3.83 | 1.42 | 6.96 | 2.04 | ||
| Compression | 8.04 | 23.05 | 2.64 | 8.24 | 2.35 | 6.63 | 1.22 | 3.90 | 2.40 | 6.39 | |||
Purpose: prevent mesh singularities, geometric discontinuities, and other non-representative local peaks from governing the global strength assessment without engineering review.
- Screen the global maximum and minimum principal stresses.
- Define material-specific tensile and compressive threshold values.
- Flag elements above the tensile threshold or below the compressive threshold.
- Review each flagged location in the FEM and identify non-representative numerical/localized peaks.
- Exclude only the confirmed non-representative elements from the failure assessment.
- Recalculate the governing principal stresses from the remaining elements and compare them with Ftu and Fcy.
- Retain any remaining critical elements within the thresholds as part of the conservative assessment.
This preserves conservative structural coverage while reducing the influence of numerical artifacts on the reported governing stress.
AL 2024-T3 CLAD Sheet (0.063” – 0.128” thick)
In the AL 2024-T3 CLAD Sheets, a tensile and compressive threshold values are set to 35 ksi and -22 ksi, respectively. The table below lists some of the flagged elements that have principal stress values falling out of the set thresholds.
Some of the Flagged Elements within the AL 2024-T3 CLAD Sheets that have Principal Stress Values Falling Out of the Set Thresholds. The results are due to applied limit loads.
| ID | FWD | UP | DOWN | INBD | OUTBD | FWD | UP | DOWN | INBD | OUTBD | ||||||||||
|---|---|---|---|---|---|---|---|---|---|---|---|---|---|---|---|---|---|---|---|---|
| TOP | BOT | |||||||||||||||||||
| F1 | F2 | F1 | F2 | F1 | F2 | F1 | F2 | F1 | F2 | F1 | F2 | F1 | F2 | F1 | F2 | F1 | F2 | F1 | F2 | |
| 235 | -1.58 | -1.97 | 22.89 | 4.85 | 0.46 | -0.16 | 8.95 | 1.89 | 1.90 | 0.38 | 4.94 | 1.11 | -0.57 | -27.93 | 0.48 | -0.68 | -0.07 | -10.90 | 0.19 | -2.33 |
| 242 | -1.80 | -3.65 | 30.68 | 2.34 | 0.50 | -0.15 | 12.05 | 0.85 | 1.86 | 0.73 | 4.59 | 1.51 | -0.48 | -39.73 | 0.28 | -1.16 | -0.03 | -15.57 | -1.06 | -2.26 |
| 287 | 8.78 | -0.54 | 3.80 | -4.91 | 3.10 | -0.56 | 1.48 | -1.96 | 1.55 | -0.63 | 0.11 | -6.39 | 6.67 | -24.38 | 0.41 | -1.87 | 2.63 | -9.57 | 0.48 | -1.36 |
| 296 | -1.27 | -3.92 | -3.80 | -24.32 | 1.81 | -0.66 | -1.71 | -10.00 | 0.04 | -0.87 | 4.03 | 0.39 | 29.63 | -2.29 | 0.47 | -3.11 | 12.16 | -0.65 | 0.72 | -1.18 |
| 305 | -2.62 | -8.00 | -5.15 | -25.26 | -0.09 | -1.37 | -2.24 | -10.39 | -0.31 | -2.64 | 10.16 | 3.49 | 30.51 | 1.97 | 1.77 | 0.14 | 12.53 | 1.05 | 3.30 | 0.19 |
| 316 | -2.92 | -28.74 | 0.84 | -24.41 | -0.43 | -0.97 | 0.32 | -10.07 | -0.42 | -2.06 | 21.40 | 3.01 | 18.86 | 0.94 | 0.83 | 0.21 | 7.77 | 0.46 | 1.74 | 0.18 |
| 327 | -4.09 | -22.08 | -0.09 | -17.36 | -0.10 | -1.27 | 0.00 | -6.92 | -0.06 | -2.35 | 17.52 | 4.01 | 14.40 | 3.05 | 1.04 | 0.29 | 5.74 | 1.11 | 1.97 | 0.58 |
| 411 | 12.66 | 1.51 | 7.20 | -1.76 | 1.22 | -0.09 | 2.68 | -0.81 | 2.05 | -0.24 | -2.16 | -23.73 | -0.80 | -12.15 | 0.09 | -0.89 | -0.33 | -4.75 | 0.20 | -1.59 |
| 415 | 12.33 | 2.01 | 6.38 | -0.84 | 1.27 | -0.11 | 2.31 | -0.40 | 2.12 | -0.27 | -2.24 | -25.03 | -1.25 | -13.13 | 0.10 | -0.98 | -0.51 | -5.15 | 0.19 | -1.75 |
| 419 | 11.52 | 2.20 | 5.18 | 0.16 | 1.28 | -0.13 | 1.79 | 0.04 | 2.13 | -0.28 | -2.07 | -25.61 | -1.50 | -13.89 | 0.11 | -1.04 | -0.60 | -5.48 | 0.19 | -1.86 |
| 423 | 10.47 | 1.81 | 3.59 | 1.17 | 1.26 | -0.14 | 1.11 | 0.49 | 2.09 | -0.28 | -1.60 | -25.49 | -1.49 | -14.41 | 0.12 | -1.07 | -0.57 | -5.73 | 0.18 | -1.92 |
| 427 | 9.58 | 0.43 | 2.50 | 1.30 | 1.21 | -0.15 | 0.99 | 0.23 | 2.00 | -0.27 | -0.79 | -24.61 | -1.19 | -14.66 | 0.14 | -1.07 | -0.41 | -5.88 | 0.16 | -1.93 |
| 431 | 9.11 | -2.33 | 3.44 | -1.13 | 1.14 | -0.16 | 1.45 | -0.82 | 1.85 | -0.26 | 0.44 | -22.93 | -0.54 | -14.56 | 0.15 | -1.05 | -0.10 | -5.90 | 0.15 | -1.90 |
Excluding these elements from the failure assessment, a new maximum and minimum principal stresses for the structural sheet metal are determined and summarized in the below table. The maximum tensile and compressive principal stresses are 28.08 ksi and 21.81 ksi, respectively, and they belong to the forward load case.
New Maximum and Minimum Principal Stresses for the AL 2024-T3 CLAD Sheets After Excluding the Flagged Elements. The results are due to applied limit loads.
| 2024-T3 ALCAD Sheet | FWD | UP | DOWN | IN | OUT | MAX Tension [ksi] |
MAX Compression [ksi] |
||||||
|---|---|---|---|---|---|---|---|---|---|---|---|---|---|
| F1 [ksi] |
F2 [ksi] |
F1 [ksi] |
F2 [ksi] |
F1 [ksi] |
F2 [ksi] |
F1 [ksi] |
F2 [ksi] |
F1 [ksi] |
F2 [ksi] |
||||
| Top | Tension | 28.08 | 10.58 | 24.96 | 9.53 | 21.27 | 10.04 | 10.13 | 3.59 | 7.04 | 3.60 | 28.08 | 21.81 |
| Compression | 15.51 | 21.51 | 9.49 | 21.81 | 10.08 | 21.25 | 3.61 | 8.52 | 3.54 | 6.55 | |||
| Bot | Tension | 19.31 | 13.13 | 23.19 | 9.55 | 21.41 | 10.16 | 9.77 | 3.49 | 6.66 | 3.45 | ||
| Compression | 11.05 | 21.72 | 9.74 | 21.33 | 10.10 | 21.53 | 3.93 | 8.64 | 3.50 | 6.88 | |||
Based on the table below, the allowable ultimate tensile strength (Ftu) and yield compressive strength (Fcy) for AL 2024-T3 CLAD Sheets are 62 ksi and 37 ksi, respectively. The margin of safety will be the lowest value between the tensile load MST and the compressive load MSC. These margins of safety can be expressed as below:
→ PASS
AL 6061-T6 and T6511 Extrusion (Thickness ≤1”)
In the AL 6061-T6 and T6511 Extrusions that have a thickness value less than or equal 1 inch, a tensile and compressive threshold values are set to 23 ksi and -21 ksi, respectively. The figure below shows the flagged elements that have principal stress values falling out of the set thresholds.
Excluding these elements from the failure assessment, a new maximum and minimum principal stresses for the structural sheet metal are determined and summarized in the below table. The maximum tensile and compressive principal stresses are 23.00 ksi and 20.95, respectively, and they belong to the forward load case.
New Maximum and Minimum Principal Stresses After Excluding the Flagged Elements. The highlighted cells represent the global maximum tensile and compressive principal stresses. The results are due to applied limit loads.
| AL 6061-T6 and T6511 Extrusions t ≤ 1” | FWD | UP | DOWN | IN | OUT | MAX Tension [ksi] |
MAX Compression [ksi] |
||||||
|---|---|---|---|---|---|---|---|---|---|---|---|---|---|
| F1 [ksi] |
F2 [ksi] |
F1 [ksi] |
F2 [ksi] |
F1 [ksi] |
F2 [ksi] |
F1 [ksi] |
F2 [ksi] |
F1 [ksi] |
F2 [ksi] |
||||
| Top | Tension | 21.22 | 9.59 | 23.00 | 9.85 | 10.34 | 2.19 | 9.39 | 4.03 | 4.55 | 1.92 | 23.00 | 20.95 |
| Compression | 7.30 | 20.74 | 8.37 | 20.95 | 1.47 | 8.66 | 3.41 | 8.76 | 1.71 | 4.02 | |||
| Bot | Tension | 17.41 | 4.14 | 12.91 | 1.98 | 7.41 | 1.85 | 5.13 | 1.87 | 4.08 | 1.56 | ||
| Compression | 3.52 | 17.86 | 1.94 | 15.47 | 1.13 | 10.75 | 2.79 | 7.52 | 1.52 | 3.69 | |||
Based on the table below, the allowable ultimate tensile strength (Ftu) and allowable yield compressive strength (Fcy) for AL 6061-T6 and T6511 Extrusions that have a thickness value ≤ 1” are 38 ksi and 34 ksi, respectively. The minimum margin of safety will be the lowest value between the tensile load MST and the compressive load MSC. These margins of safety can be expressed as below:
→ PASS
Flange Crippling
Crippling is a mode of failure that occurs due to compression effects. Typically, this is a check that is applied to thin-walled columns where the local stability of the cross section may not allow the column to achieve its full column strength.
To calculate the Crippling Allowable of the Attachment Angles, Needham and Gerard Method is used. Needham's method divides the structural section into angle elements whose individual crippling strengths are determined experimentally and summed to obtain the total section strength. Instead of determining crippling strengths experimentally, semi-empirical equations were used as proposed in the relevant discussion in [Stress Analysis Manual-Air Force Flight Dynamics Laboratory-Wright-Patterson]. Moreover, the Attachment Angles cross-sections are modified, as shown below to simplify the analysis.
| Angle # | h | th | b | tb | An | Ce | Fccn | AnFccn |
|---|---|---|---|---|---|---|---|---|
| 1 | 1.000 | 0.125 | 0.563 | 0.250 | 0.391 | 0.342 | 50.184 | 19.610 |
| 2 | 1.125 | 0.125 | 0.563 | 0.250 | 0.422 | 0.342 | 47.371 | 19.990 |
| Σ | 1.040 | 45.833 | ||||||
FCrippling [ksi] |
44.06 |
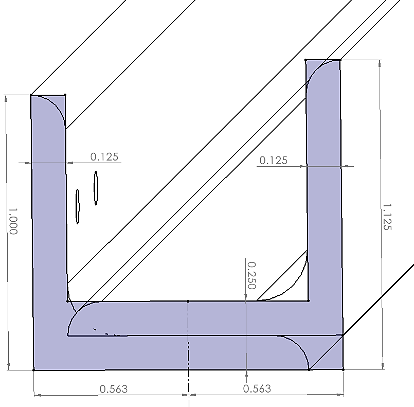
Ce=0.316 for 2-edges free, 0.342 for 1-edge free, and 0.366 for no edge free. Fccn is expressed below:
Where: h and b are the angle’s height and width, respectively. tmin is the minimum thickness in the angle. Fcy is Material compressive yield Strength. E is Material young’s modulus.
As previously shown, the maximum principal compressive stress is 20.95 ksi. Therefore, the minimum margin of safety for the Attachment Angle against crippling can be computed as below:
→PASS
Supporting Structure’s Sheets
The maximum principal stress (F1) and the minimum principal stress (F2) on both sides of the plates were reviewed for all cases, and it is summarized in the table below.
Maximum and Minimum Principal Stresses for the Structural Sheet Metals. The highlighted cells represent the global maximum tensile and compressive principal stresses. The results are due to applied limit loads.
AL 2024-T3 CLAD Sheet [t=0.063” – 0.128”] |
FWD | UP | DOWN | IN | OUT | MAX Tension [ksi] |
MAX Compression [ksi] |
||||||
|---|---|---|---|---|---|---|---|---|---|---|---|---|---|
| F1 [ksi] |
F2 [ksi] |
F1 [ksi] |
F2 [ksi] |
F1 [ksi] |
F2 [ksi] |
F1 [ksi] |
F2 [ksi] |
F1 [ksi] |
F2 [ksi] |
||||
| Top | Tension | 11.82 | 3.61 | 12.13 | 3.72 | 0.27 | 0.04 | 4.91 | 1.51 | 0.73 | 0.21 | 12.15 | 8.29 |
| Compression | 1.11 | 3.45 | 1.86 | 4.66 | 0.06 | 0.33 | 0.74 | 1.82 | 0.08 | 0.70 | |||
| Bot | Tension | 11.85 | 3.94 | 12.15 | 4.06 | 0.29 | 0.11 | 4.93 | 1.65 | 0.73 | 0.23 | ||
| Compression | 5.42 | 6.93 | 6.36 | 8.29 | 0.16 | 0.42 | 2.55 | 3.30 | 0.52 | 1.04 | |||
AL 2024-T3 CLAD Sheet [t=0.129"-0.249"] |
FWD | UP | DOWN | IN | OUT | MAX Tension [ksi] |
MAX Compression [ksi] |
||||||
| F1 [ksi] |
F2 [ksi] |
F1 [ksi] |
F2 [ksi] |
F1 [ksi] |
F2 [ksi] |
F1 [ksi] |
F2 [ksi] |
F1 [ksi] |
F2 [ksi] |
||||
| Top | Tension | 10.79 | 8.02 | 10.75 | 7.96 | 0.19 | 0.12 | 4.34 | 3.21 | 0.77 | 0.55 | 10.79 | 8.63 |
| Compression | 3.76 | 4.74 | 4.43 | 5.21 | 0.20 | 0.26 | 1.80 | 2.12 | 0.21 | 0.35 | |||
| Bot | Tension | 3.48 | 2.66 | 3.86 | 3.05 | 0.21 | 0.11 | 1.57 | 1.24 | 0.33 | 0.17 | ||
| Compression | 5.96 | 7.91 | 6.78 | 8.63 | 0.13 | 0.27 | 2.73 | 3.44 | 0.50 | 0.84 | |||
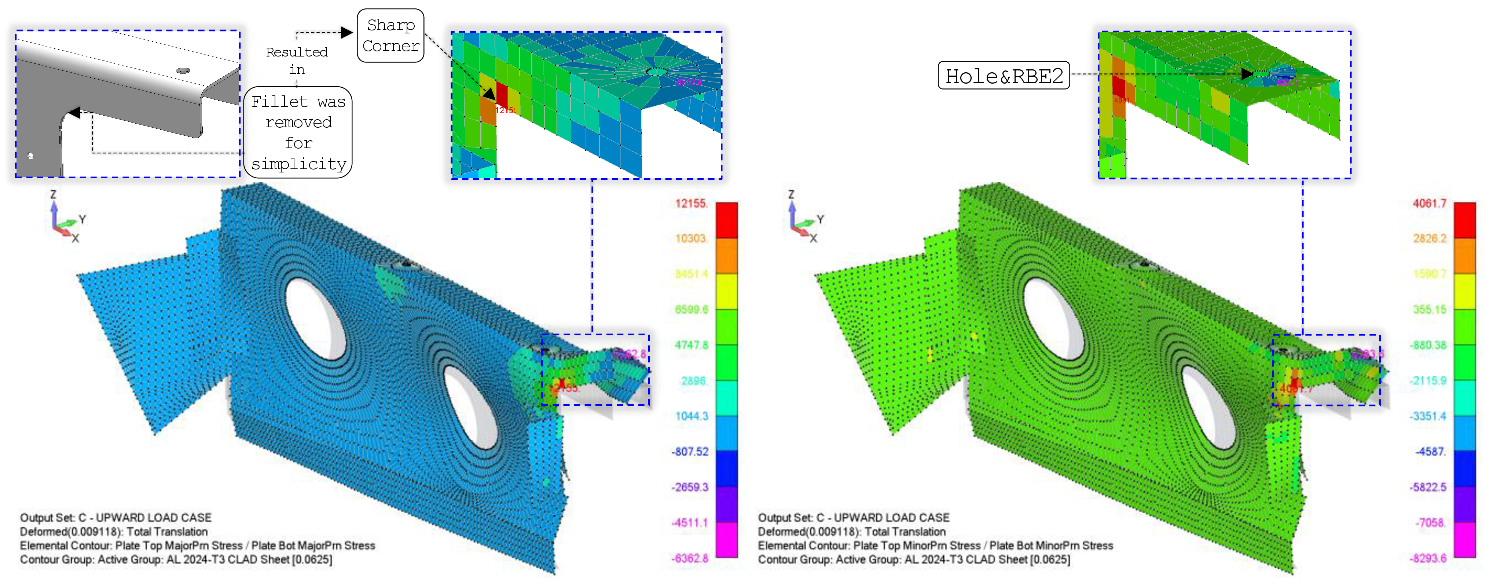
The cells shaded in grey represent the global maximum tensile and compressive principal stresses. Upon reviewing the Finite Element Model (FEM), and as shown the below figures, these stresses are associated with localized critical locations exhibiting peak values. Such stresses are typically irregular and are often excluded from overall failure assessments, as they do not represent the overall stress distribution across the structure. These irregularities are commonly attributed to mesh singularities, geometric discontinuities, or sharp stress gradients, necessitating careful evaluation. However, these elements will be included in the failure assessment as part of a conservative methodology.
Flange Crippling
Crippling is a mode of failure that occurs due to compression effects. Typically, this is a check that is applied to thin-walled columns where the local stability of the cross section may not allow the column to achieve its full column strength. To calculate the Crippling Allowable of the Intercostal Flange, Needham and Gerard Method is used. Needham's method divides the structural section into angle elements whose individual crippling strengths are determined experimentally and summed to obtain the total section strength. Instead of determining crippling strengths experimentally, semi-empirical equations were used as proposed in the relevant discussion in [Stress Analysis Manual-Air Force Flight Dynamics Laboratory-Wright-Patterson]. Moreover, the Intercostal Flange’s cross-section is modified, as shown below to simplify the analysis.
| Angle # | h | th | b | tb | An | Ce | Fccn | AnFccn |
|---|---|---|---|---|---|---|---|---|
| 1 | 0.913 | 0.063 | 0.813 | 0.063 | 0.108 | 0.342 | 29.759 | 3.210 |
| 2 | 0.913 | 0.063 | 0.813 | 0.063 | 0.108 | 0.342 | 29.759 | 3.210 |
| Σ | 0.216 | 6.421 | ||||||
FCrippling [ksi] |
29.76 |
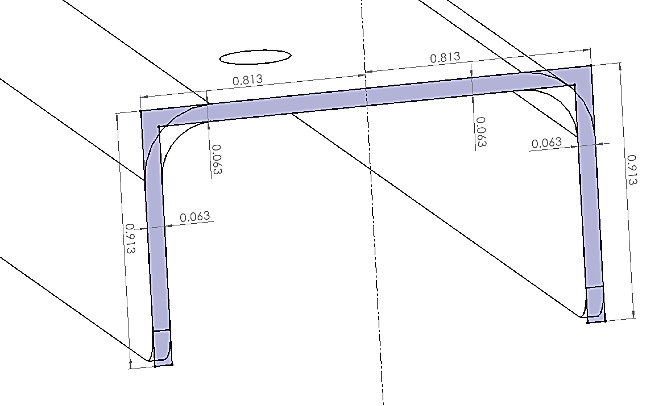
Ce=0.316 for 2-edges free, 0.342 for 1-edge free, and 0.366 for no edge free. Fccn is expressed below:
Where: h and b are the angle’s height and width, respectively. tmin is the minimum thickness in the angle. Fcy is Material compressive yield Strength. E is Material young’s modulus. As previously shown, the maximum principal compressive stress is 8.29 ksi.
Therefore, the minimum margin of safety for the Intercostal Flange against crippling can be computed as below:
→ PASS
Fasteners
Main Attachment Points
As show in the below figure, the Air conditioning Rack is fixed at the inboard side to ANCRA Seat Tracks through 2x ANCRA Single Stud Fittings at joints J1 and J2. At the outboard side, the rack is fixed to a newly added Intercostal through 3x AN4‑11A Bolts and NAS1834-4-500 Inserts at joint J30. The table below lists the reversed reaction forces components at each attachment point in all load cases. Additionally, the resultant shear and tensile forces at these points are listed in the following table.
The Reversed Reaction Forces [lbf] at the Main Attachment Points. The results are due to applied limit loads.
| Load Case | FORWARD | INBOARD | OUTBOARD | UPWARD | DOWNWARD | |||||||||||
|---|---|---|---|---|---|---|---|---|---|---|---|---|---|---|---|---|
| Balloon No | ID | fx | fy | fz | fx | fy | fz | fx | fy | fz | fx | fy | fz | fx | fy | fz |
| 1 | 12186 | -296.91 | 86.93 | 430.37 | 12.93 | -132.93 | -57.06 | -2.74 | 94.54 | 84.43 | 8.43 | -29.97 | 196.21 | -18.54 | -18.34 | -142.31 |
| 2 | 8990 | -1.69 | -203.37 | -449.52 | -15.97 | -136.76 | -98.18 | -2.10 | 38.47 | 49.50 | -36.67 | -161.58 | -3.55 | 22.21 | -30.92 | -113.44 |
| 6 | 27266 | -210.16 | 74.52 | -26.35 | -106.06 | 51.60 | 97.79 | -12.01 | 38.25 | 6.77 | -254.62 | 130.34 | 249.27 | -2.26 | 36.14 | -8.77 |
| 7 | 28002 | -475.88 | -45.60 | -165.34 | -131.25 | -20.05 | -78.66 | -66.82 | -30.83 | -11.15 | -332.26 | -58.47 | -193.11 | -33.43 | -19.48 | -3.75 |
| 8 | 25403 | 391.17 | 87.52 | 331.00 | 240.36 | 40.32 | 136.12 | 83.67 | 57.39 | 22.18 | 615.12 | 119.69 | 336.75 | 32.02 | 32.61 | 4.41 |
The resultant shear and tensile forces components [lbf] of the Reversed Reaction Forces. The results are due to applied limit loads.
| Load Case | FORWARD | INBOARD | OUTBOARD | UPWARD | DOWNWARD | ||||||
|---|---|---|---|---|---|---|---|---|---|---|---|
| Balloon No | ID | fshear | ftensile | fshear | ftensile | fshear | ftensile | fshear | ftensile | fshear | ftensile |
| 1 | 12186 | 309.37 | 430.37 | 133.55 | -57.06 | 94.58 | 84.43 | 31.13 | 196.21 | 26.08 | -142.31 |
| 2 | 8990 | 203.38 | -449.52 | 137.69 | -98.18 | 38.52 | 49.50 | 165.69 | -3.55 | 38.07 | -113.44 |
| 6 | 27266 | 222.98 | -26.35 | 117.95 | 97.79 | 40.09 | 6.77 | 286.04 | 249.27 | 36.21 | -8.77 |
| 7 | 28002 | 478.06 | -165.34 | 132.78 | -78.66 | 73.59 | -11.15 | 337.37 | -193.11 | 38.69 | -3.75 |
| 8 | 25403 | 400.84 | 331.00 | 243.71 | 136.12 | 101.46 | 22.18 | 626.66 | 336.75 | 45.70 | 4.41 |
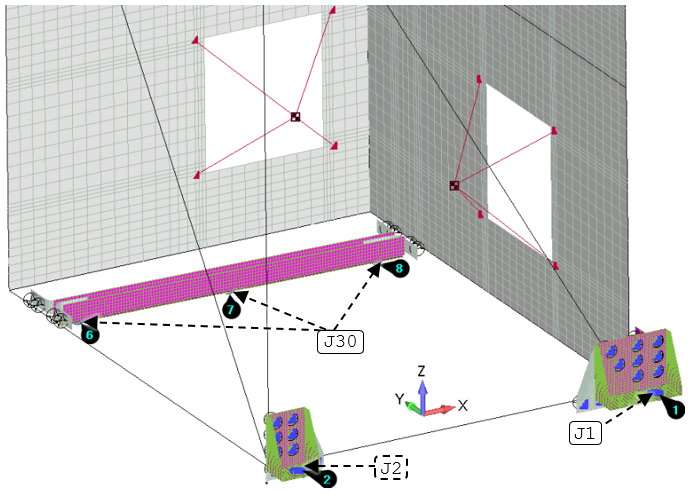
NOTE: The negative values of tensile loads indicate that these loads act as compressive loads. This isn't critical since the loads will be distributed over a wider area across the attachment surface.
ANCRA SINGLE STUD FITTING
The maximum shear and tensile forces carried by the ANCRA Single Stud Fitting are 309.37 lbf and 430.37 lbf, respectively (LIMIT LOADS). These loads belong to the forward load case. The ultimate shear and tensile load capacities at joints J1 and J2 are 4,200 lbf and 5,700 lbf, respectively. Therefore, the minimum margin of safety of these studs can be calculated as below:
→ PASS
→ PASS
AN4-11A Bolts and NAS1834-4-500 Inserts
The maximum shear and tensile forces carried by the AN4-11A Bolts are 626.66 lbf and 336.75 lbf, respectively (LIMIT LOADS). These loads belong to the upward load case. The ultimate shear and tensile load capacities at joint J30 are 1,968 lbf and 4,080 lbf, respectively. Therefore, the minimum margin of safety of these studs can be calculated as below:
→ PASS
→ PASS
Installation Panels
The plate-force post-processing was automated to reduce repetitive manual work and improve traceability. The script reads FEMAP-exported element and nodal data, rejects triangular elements, calculates element dimensions, converts membrane resultants to elemental forces, screens all load cases, and writes governing results to a summary workbook.
- Read the FEMAP Excel export and nodal coordinates.
- Extract nodal-coordinate values (X-Def, Y-Def, Z-Def).
- Filter valid quadrilateral plate elements.
- Calculate element dimensions and local force directions.
- Recover nx, ny, nxy, qx, and qy for every element and load case.
- Calculate elemental shear and tensile demand.
A conservative in-plane resultant is calculated as:
- Generate contour maps and a governing-result summary.
- 2D plot of elements and nodes.
- Heat maps for maximum shear load and maximum tensile load for every load case.
- Extract maximum membrane forces, shear, and tensile loads from each load case and save them to a new summary table.
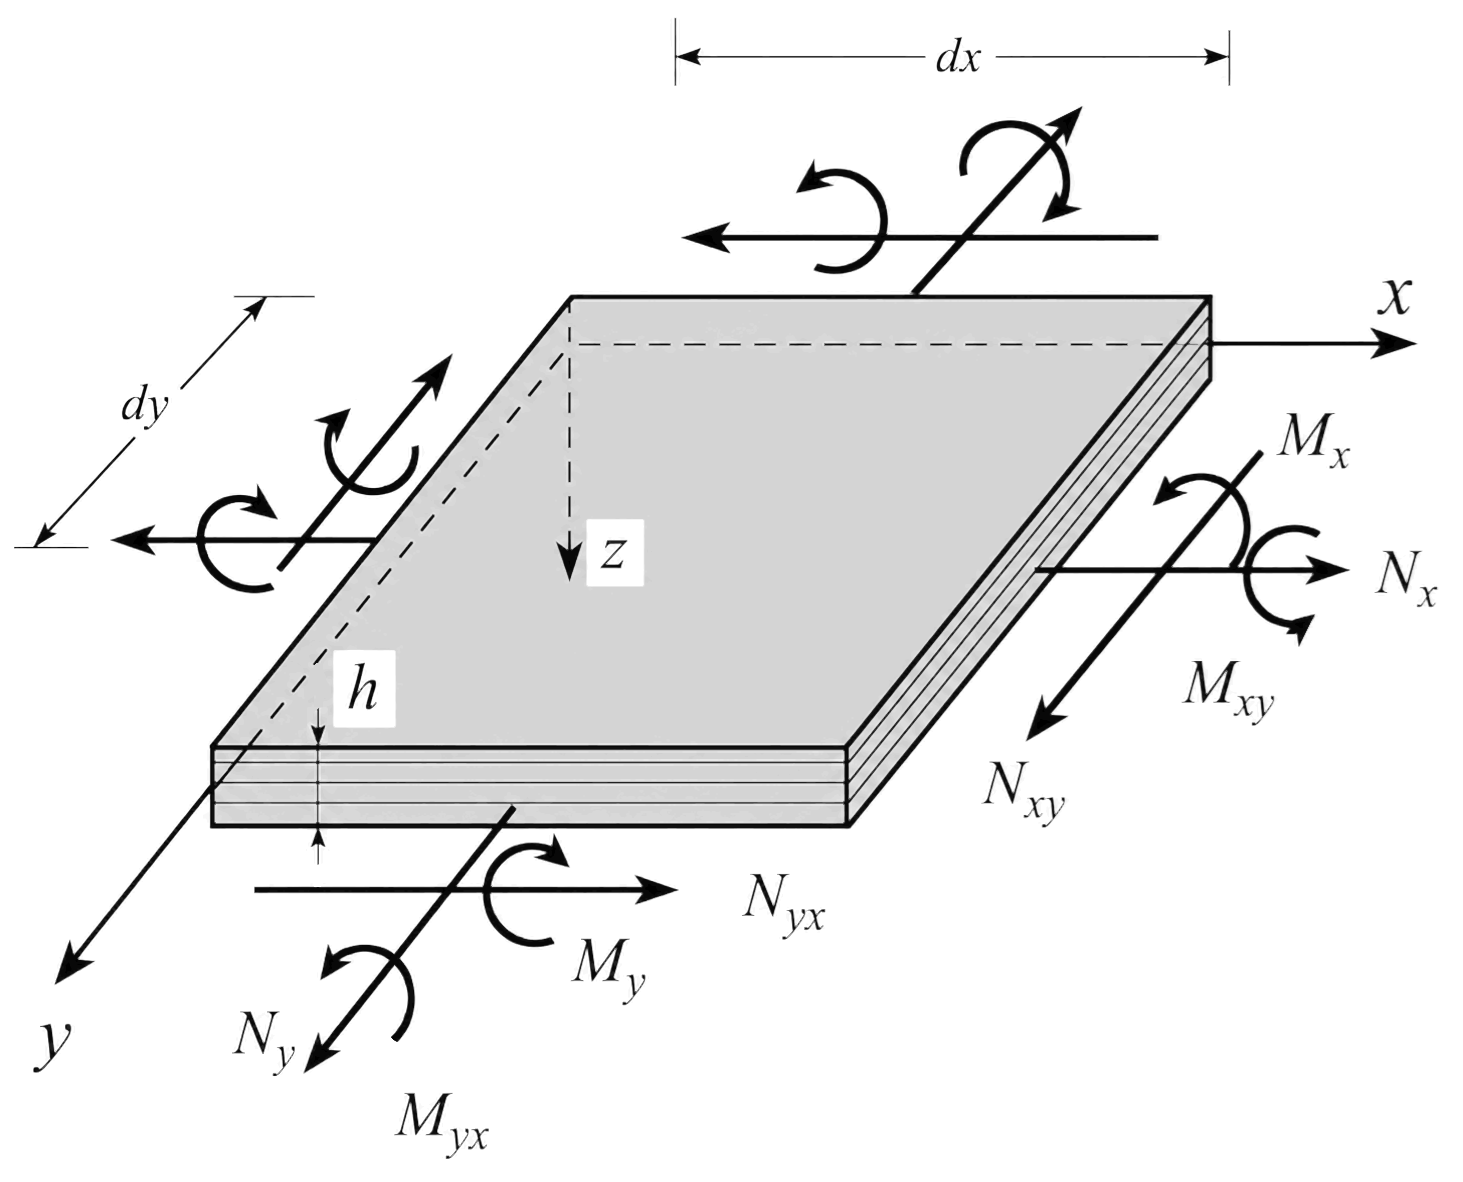
Why I automated this stepThe governing plate element was not necessarily the element with the largest individual nx, ny, or nxy component. Automation allowed every valid plate element and load case to be evaluated using one documented equation set, eliminating inconsistent spreadsheet manipulation and preserving a repeatable audit trail.
AFT Skin Rivets
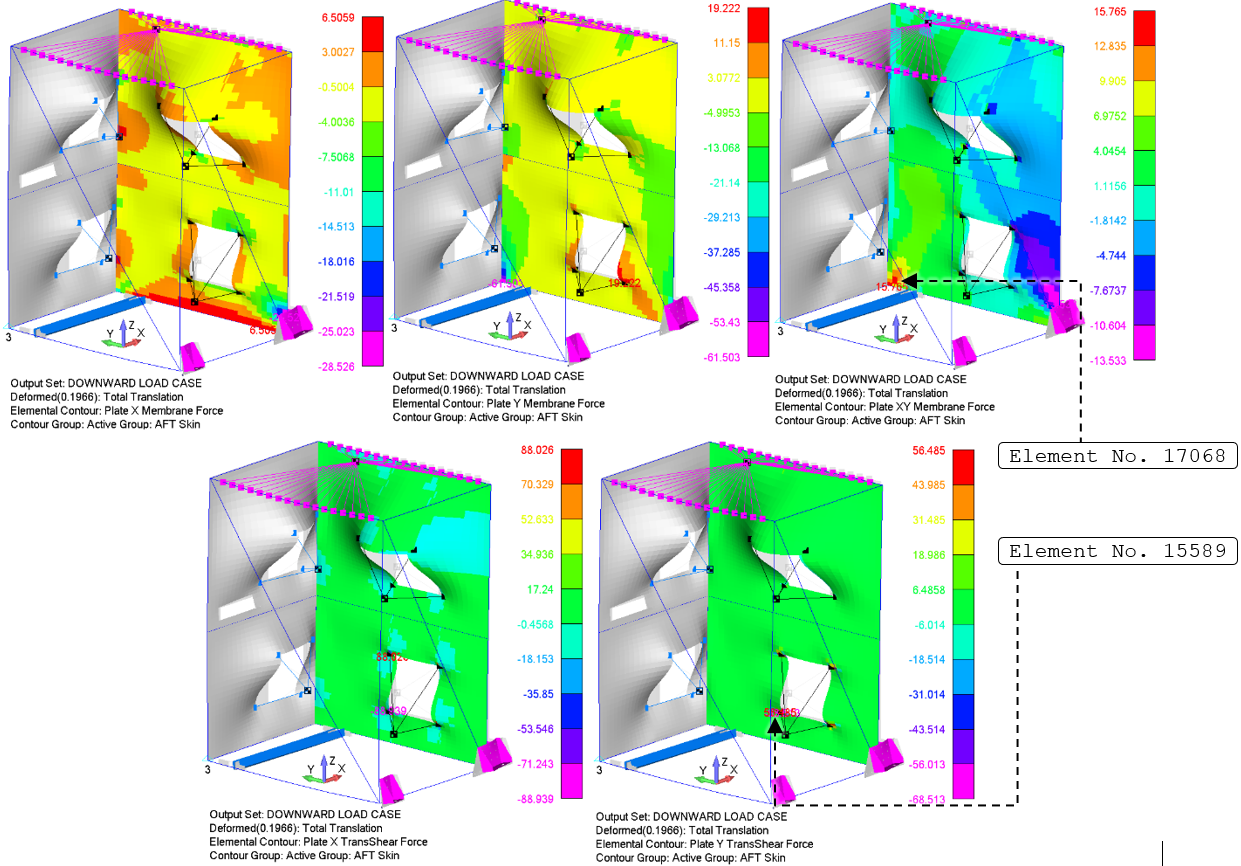
The AFT skin is fixed to the tube structure through ARM/4 (CR3212) rivets at 1-inch typical pitch (joint J10). The figure below illustrates the Membrane Forces, Shear Flows, Shear Forces per unit length for the AFT Skin.
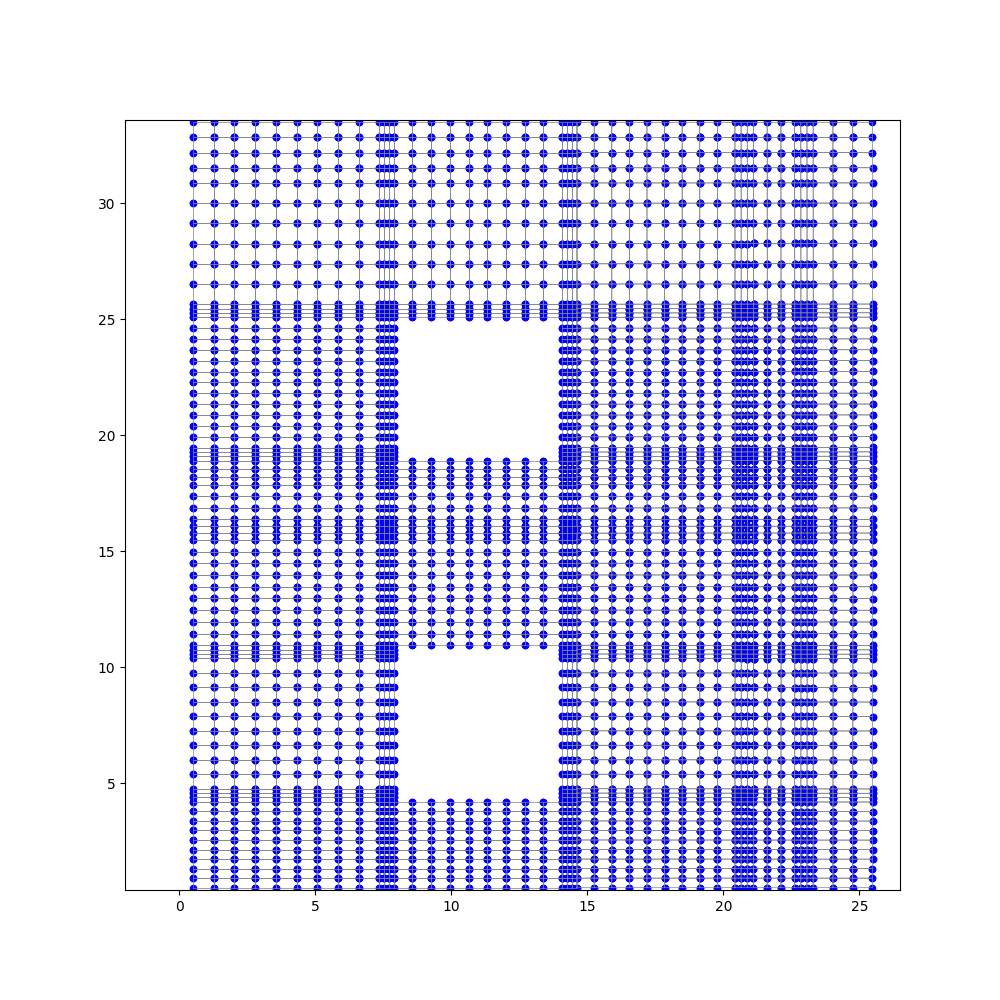
The python code is used to calculate the elements’ forces. Then the maximum values of these forces were used to calculate the Maximum Shear and Tensile forces for each load case. These forces are summarized in the table below. The Nodes and Elements coordinates extracted from the FEMAP results file are shown in the figure below. The detailed elemental results are exported into excel sheet.
The Maximum Elements’ Plate, Shear, and Tensile Forces and the resulted maximum Shear and Tensile loads for all load cases. The results are due to applied limit loads.
| Load Case | Nx,max [lbf] |
Ny,max [lbf] |
Nxy-x,max [lbf] |
Nxy-y,max [lbf] |
Qx,max [lbf] |
Qy,max [lbf] |
fs,max [lbf] |
ft,max [lbf] |
|---|---|---|---|---|---|---|---|---|
| FWD | 21.45 | 27.02 | 9.34 | 12.52 | 4.61 | 5.08 | 38.18 | 6.06 |
| INBD | 6.06 | 14.06 | 3.28 | 5.74 | 10.81 | 9.61 | 21.89 | 11.56 |
| OUTBD | 11.10 | 9.81 | 5.09 | 7.37 | 4.57 | 9.87 | 20.59 | 8.93 |
| UPWD | 11.16 | 33.52 | 9.14 | 14.96 | 26.05 | 12.83 | 36.54 | 22.91 |
| DOWNWD | 3.11 | 11.38 | 6.62 | 11.74 | 26.94 | 36.99 | 40.17 | 37.66 |
As illustrated previously, the maximum shear and tensile values are 38.86 lbf and 37.65 lbf, respectively (LIMIT LOADS), these belong to downward load case, and it occurs at elements 17068 and 15589, respectively. The joint J10 has an ultimate shear and tensile strength values of fsu=428 lbf and ftu=114 lbf, respectively. Therefore, the rivet’s margin of safety against shear and tensile loads can be expressed as below:
→ PASS
→ PASS
Avionics Box Rivets
The Avionics Box is fixed to the FWD and AFT side of the Tube Structure through 17x ARN/4N (CR3213) Rivets at each side. The Multipoint Forces at the rivets’ locations are extracted from the FEM, and it is tabulated in the below table. These forces are illustrated in
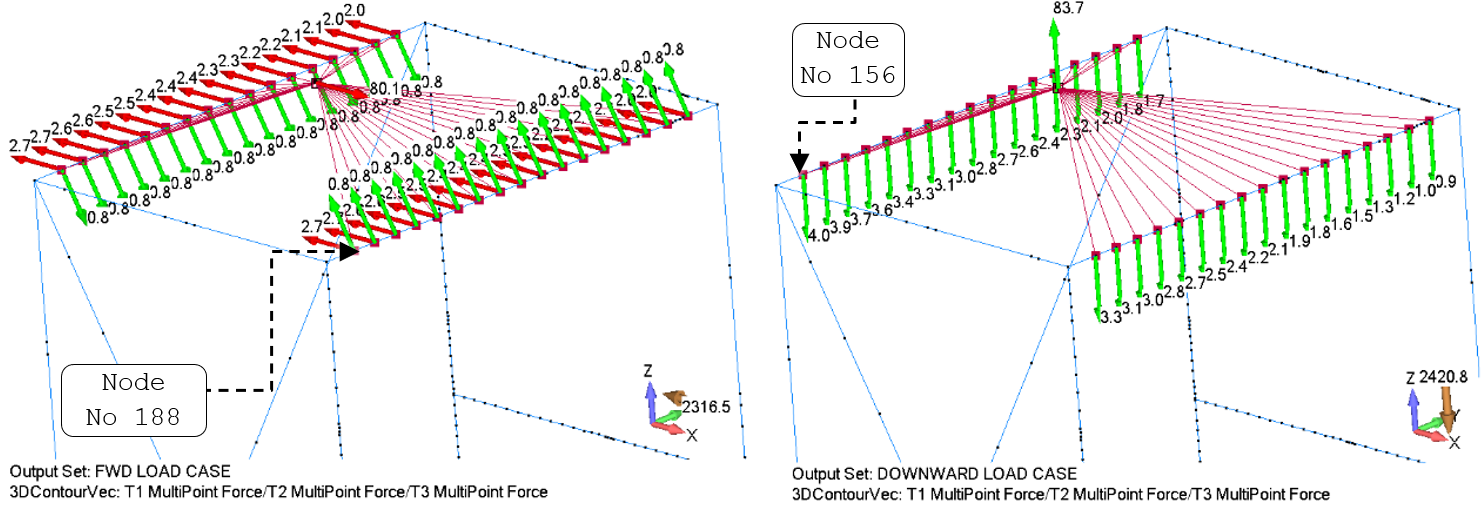
The Multipoint Forces at the Avionics Box Rivets’ locations for All Load Cases. The results are due to applied limit loads.
| Location | ID | FWD | INBD | OUTBD | UPWD | DOWNWD | |||||
|---|---|---|---|---|---|---|---|---|---|---|---|
Shear Load |
Axial Load |
Shear Load |
Axial Load |
Shear Load |
Axial Load |
Shear Load |
Axial Load |
Shear Load |
Axial Load |
||
| AFT SIDE | 188 | 0.85 | -2.72 | 0.94 | 0.09 | 0.94 | -0.09 | 3.08 | 0.00 | 3.26 | 0.00 |
| 190 | 0.85 | -1.99 | 0.94 | -0.09 | 0.94 | 0.09 | 0.85 | 0.00 | 0.90 | 0.00 | |
| 381 | 0.85 | -2.67 | 0.89 | 0.08 | 0.89 | -0.08 | 2.94 | 0.00 | 3.11 | 0.00 | |
| 382 | 0.85 | -2.63 | 0.84 | 0.07 | 0.84 | -0.07 | 2.80 | 0.00 | 2.96 | 0.00 | |
| 383 | 0.85 | -2.58 | 0.80 | 0.06 | 0.80 | -0.06 | 2.66 | 0.00 | 2.81 | 0.00 | |
| 390 | 0.85 | -2.54 | 0.77 | 0.05 | 0.77 | -0.05 | 2.52 | 0.00 | 2.67 | 0.00 | |
| 391 | 0.85 | -2.49 | 0.74 | 0.04 | 0.74 | -0.04 | 2.38 | 0.00 | 2.52 | 0.00 | |
| 392 | 0.85 | -2.45 | 0.72 | 0.02 | 0.72 | -0.02 | 2.24 | 0.00 | 2.37 | 0.00 | |
| 393 | 0.85 | -2.40 | 0.71 | 0.01 | 0.71 | -0.01 | 2.10 | 0.00 | 2.22 | 0.00 | |
| 408 | 0.85 | -2.36 | 0.70 | 0.00 | 0.70 | 0.00 | 1.96 | 0.00 | 2.08 | 0.00 | |
| 409 | 0.85 | -2.31 | 0.71 | -0.01 | 0.71 | 0.01 | 1.82 | 0.00 | 1.93 | 0.00 | |
| 410 | 0.85 | -2.26 | 0.72 | -0.02 | 0.72 | 0.02 | 1.68 | 0.00 | 1.78 | 0.00 | |
| 411 | 0.85 | -2.22 | 0.74 | -0.04 | 0.74 | 0.04 | 1.54 | 0.00 | 1.63 | 0.00 | |
| 426 | 0.85 | -2.17 | 0.77 | -0.05 | 0.77 | 0.05 | 1.40 | 0.00 | 1.49 | 0.00 | |
| 427 | 0.85 | -2.13 | 0.80 | -0.06 | 0.80 | 0.06 | 1.26 | 0.00 | 1.34 | 0.00 | |
| 428 | 0.85 | -2.08 | 0.84 | -0.07 | 0.84 | 0.07 | 1.13 | 0.00 | 1.19 | 0.00 | |
| 429 | 0.85 | -2.04 | 0.89 | -0.08 | 0.89 | 0.08 | 0.99 | 0.00 | 1.04 | 0.00 | |
| FWD SIDE | 156 | 0.85 | -2.72 | 1.07 | 0.09 | 1.07 | -0.09 | 3.80 | 0.00 | 4.03 | 0.00 |
| 194 | 0.85 | -1.99 | 1.07 | -0.09 | 1.07 | 0.09 | 1.57 | 0.00 | 1.67 | 0.00 | |
| 196 | 0.85 | -2.67 | 1.02 | 0.08 | 1.02 | -0.08 | 3.66 | 0.00 | 3.88 | 0.00 | |
| 208 | 0.85 | -2.63 | 0.99 | 0.07 | 0.99 | -0.07 | 3.52 | 0.00 | 3.73 | 0.00 | |
| 210 | 0.85 | -2.58 | 0.95 | 0.06 | 0.95 | -0.06 | 3.38 | 0.00 | 3.58 | 0.00 | |
| 211 | 0.85 | -2.54 | 0.92 | 0.05 | 0.92 | -0.05 | 3.24 | 0.00 | 3.44 | 0.00 | |
| 212 | 0.85 | -2.49 | 0.90 | 0.04 | 0.90 | -0.04 | 3.11 | 0.00 | 3.29 | 0.00 | |
| 226 | 0.85 | -2.45 | 0.88 | 0.02 | 0.88 | -0.02 | 2.97 | 0.00 | 3.14 | 0.00 | |
| 227 | 0.85 | -2.40 | 0.87 | 0.01 | 0.87 | -0.01 | 2.83 | 0.00 | 2.99 | 0.00 | |
| 228 | 0.85 | -2.36 | 0.87 | 0.00 | 0.87 | 0.00 | 2.69 | 0.00 | 2.85 | 0.00 | |
| 229 | 0.85 | -2.31 | 0.87 | -0.01 | 0.87 | 0.01 | 2.55 | 0.00 | 2.70 | 0.00 | |
| 340 | 0.85 | -2.26 | 0.88 | -0.02 | 0.88 | 0.02 | 2.41 | 0.00 | 2.55 | 0.00 | |
| 376 | 0.85 | -2.22 | 0.90 | -0.04 | 0.90 | 0.04 | 2.27 | 0.00 | 2.40 | 0.00 | |
| 377 | 0.85 | -2.17 | 0.92 | -0.05 | 0.92 | 0.05 | 2.13 | 0.00 | 2.26 | 0.00 | |
| 378 | 0.85 | -2.13 | 0.95 | -0.06 | 0.95 | 0.06 | 1.99 | 0.00 | 2.11 | 0.00 | |
| 379 | 0.85 | -2.08 | 0.99 | -0.07 | 0.99 | 0.07 | 1.85 | 0.00 | 1.96 | 0.00 | |
| 380 | 0.85 | -2.04 | 1.02 | -0.08 | 1.02 | 0.08 | 1.71 | 0.00 | 1.81 | 0.00 | |
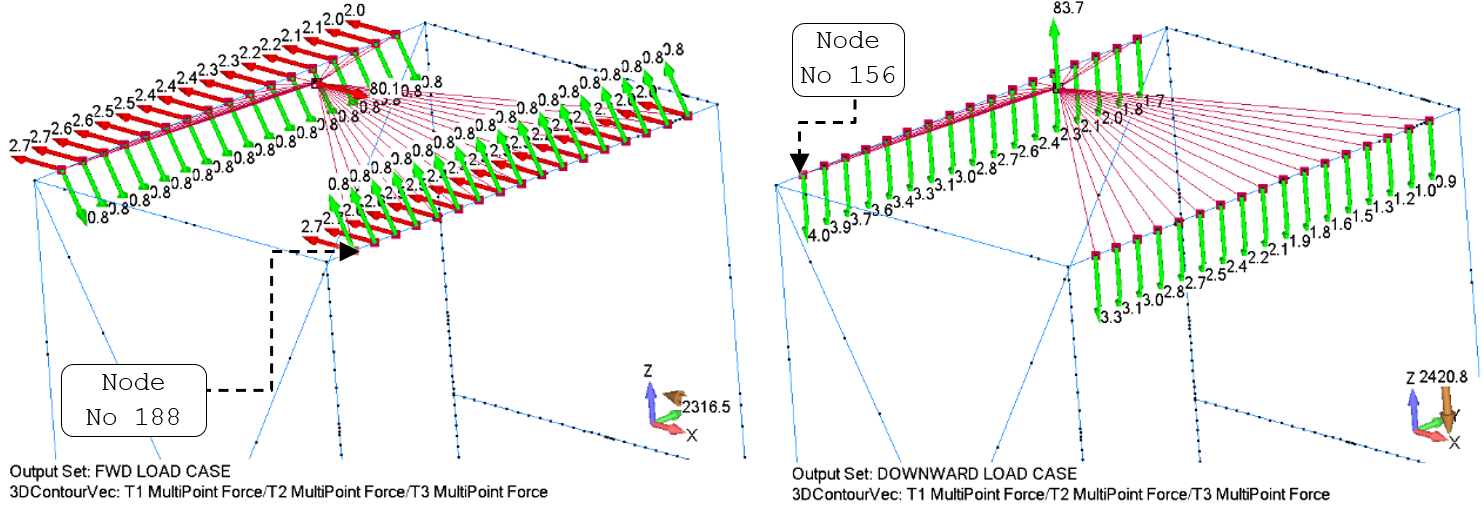
The maximum shear and tensile forces carried by an ARN/4N (CR3213) Rivet are 4.03 lbf and 2.72 lbf, respectively (LIMIT LOADS). These values belong to the downward and forward load cases, respectively. Additionally, the reaction forces at these rivets were calculated using the 3D Rigid Body Analysis. For conservativism, it was assumed that only two rivets at each side will carry the load. The below table lists the resulted shear and axial loads on each of these rivets. Thje maximum shear and tensile forces carried by an ARN/4N (CR3213) Rivet are 27.96 lbf and 22.04 lbf, respectively (LIMIT LOADS). These values belong to the downward and forward load cases, respectively. This joint configuration (J6) has an ultimate shear and tensile strength values of fsu=482 lbf and ftu=129 lbf, respectively. Therefore, these rivets pass by observation.
The Shear and Axial Loads [lbf] reacted by the four rivets located at the corners of the Avionics Box. The results are due to applied limit loads.
| Fastener Location | FWD-INBD | FWD-OUTBD | AFT-OUTBD | AFT-INBD | ||||
|---|---|---|---|---|---|---|---|---|
| Load Case | Shear Load |
Axial Load |
Shear Load |
Axial Load |
Shear Load |
Axial Load |
Shear Load |
Axial Load |
| FORWARD | 6.92 | 22.04 | 6.92 | 22.04 | 6.92 | 18.01 | 6.92 | 18.01 |
| INBOARD | 7.40 | -0.52 | 6.52 | -0.52 | 6.52 | 0.52 | 7.40 | 0.52 |
| OUTBOARD | 7.40 | 0.52 | 6.52 | 0.52 | 6.52 | -0.52 | 7.40 | -0.52 |
| UPWARD | 26.40 | 0.00 | 20.22 | 0.00 | 13.12 | 0.00 | 19.30 | 0.00 |
| DOWNWARD | 27.96 | 0.00 | 21.42 | 0.00 | 13.89 | 0.00 | 20.44 | 0.00 |
Extended Rack Mount Fitting Fasteners
Extended Rack Mount Fitting – Tube Structure
The Extended Rack Mount Fitting is fixed to the Tube Structure through 5x ARN/4N (CR3213) rivets that pass through the AFT Gusset at joint J3. The table belowlists the MultiPoint Forces at these rivets, and the other table lists the resultant shear and axial forces.
The MultiPoint Forces [lbf]. The results are due to applied limit loads.
| Load Case | FORWARD | INBOARD | OUTBOARD | UPWARD | DOWNWARD | |||||||||||
|---|---|---|---|---|---|---|---|---|---|---|---|---|---|---|---|---|
| Balloon No | ID | fx | fy | fz | fx | fy | fz | fx | fy | fz | fx | fy | fz | fx | fy | fz |
| 1 | 14754 | -118.60 | -96.26 | -39.10 | 0.64 | -4.74 | -5.48 | -4.23 | -1.48 | 16.47 | -31.89 | -33.19 | 23.35 | 7.92 | -3.97 | -10.03 |
| 2 | 14755 | 80.44 | -48.67 | -112.24 | 6.26 | -2.07 | 4.04 | -19.40 | -10.67 | -10.31 | -4.84 | -11.69 | -25.06 | -4.51 | -15.61 | 1.88 |
| 3 | 15130 | 115.15 | -9.55 | -24.56 | -18.02 | -0.05 | 8.34 | 35.65 | -2.08 | -2.52 | 75.68 | -10.63 | -24.45 | -51.83 | -0.07 | 40.13 |
| 4 | 14756 | 97.17 | -6.26 | -76.98 | -11.60 | 0.00 | 13.19 | 18.31 | -10.91 | -18.08 | 23.14 | -4.39 | -51.75 | -6.12 | -3.33 | 41.06 |
| 5 | 12080 | 151.06 | -3.38 | -147.93 | -4.72 | -0.01 | 37.34 | -3.47 | -38.45 | -72.88 | -39.51 | -0.57 | -83.71 | 37.23 | -26.51 | 30.39 |
The resultant shear and axial forces components [lbf] of the MultiPoint Forces. The results are due to applied limit loads.
| Load Case | FORWARD | INBOARD | OUTBOARD | UPWARD | DOWNWARD | ||||||
|---|---|---|---|---|---|---|---|---|---|---|---|
| Balloon No | ID | fshear | faxial | fshear | faxial | fshear | faxial | fshear | faxial | fshear | faxial |
| 1 | 14754 | 124.88 | -96.26 | 5.51 | -4.74 | 17.00 | -1.48 | 39.52 | -33.19 | 12.78 | -3.97 |
| 2 | 14755 | 138.09 | -48.67 | 7.45 | -2.07 | 21.97 | -10.67 | 25.52 | -11.69 | 4.89 | -15.61 |
| 3 | 15130 | 117.74 | -9.55 | 19.86 | -0.05 | 35.73 | -2.08 | 79.53 | -10.63 | 65.55 | -0.07 |
| 4 | 14756 | 123.97 | -6.26 | 17.56 | 0.00 | 25.73 | -10.91 | 56.68 | -4.39 | 41.52 | -3.33 |
| 5 | 12080 | 211.43 | -3.38 | 37.64 | -0.01 | 72.96 | -38.45 | 92.57 | -0.57 | 48.06 | -26.51 |
The maximum shear and axial forces carried by an ARN/4N (CR3213) Rivet are 211.43 lbf and 96.26 lbf, respectively (LIMIT LOADS). These values belong to the forward load case. This joint configuration (J3) has an ultimate shear and tensile strength values of fsu=1,278 lbf and ftu=228 lbf, respectively. Therefore, the minimum margin of safety of these rivets can be calculated as below:
→ PASS
→ PASS
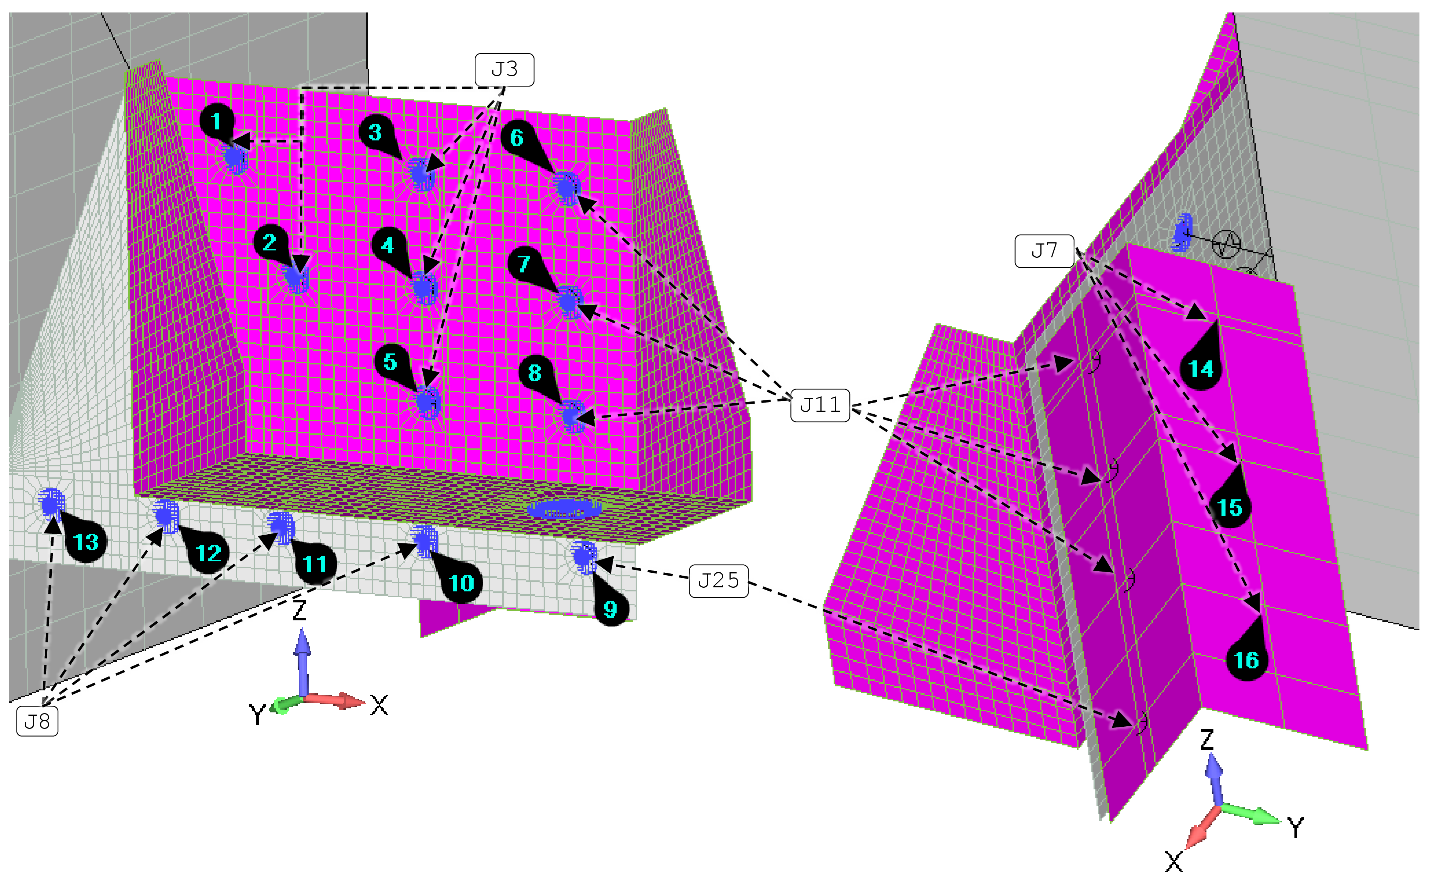
AFT Gusset – Tube Structure
The AFT Gusset is fixed to the Tube Structure through 4x ARM/4 (CR3212) rivets at joint J8. The table below lists the MultiPoint Forces at these rivets, and the table below lists the resultant shear and axial forces.
The MultiPoint Forces [lbf]. The results are due to applied limit loads.
| Load Case | FORWARD | INBOARD | OUTBOARD | UPWARD | DOWNWARD | |||||||||||
|---|---|---|---|---|---|---|---|---|---|---|---|---|---|---|---|---|
| Balloon No | ID | fx | fy | fz | fx | fy | fz | fx | fy | fz | fx | fy | fz | fx | fy | fz |
| 10 | 6959 | 4.63 | 110.96 | -389.71 | -30.25 | 37.84 | 22.83 | 21.54 | -10.88 | -37.88 | 1.24 | 61.92 | -169.05 | 15.97 | -28.05 | 109.39 |
| 11 | 6958 | 99.99 | 39.73 | -87.81 | 7.90 | 12.34 | 9.99 | -19.70 | -1.78 | -21.12 | -21.46 | 34.82 | -50.44 | 22.83 | -15.86 | 46.08 |
| 12 | 6957 | 127.92 | -5.69 | -3.64 | 27.88 | 0.32 | 3.70 | -24.44 | 2.30 | -9.56 | -9.08 | 13.25 | -8.73 | 12.36 | -6.78 | 11.70 |
| 13 | 6948 | 88.19 | -53.84 | 91.52 | 17.87 | -10.50 | 0.42 | -12.92 | 7.20 | 7.88 | 7.22 | -5.20 | 42.58 | 0.55 | 0.82 | -27.79 |
The resultant shear and axial forces components [lbf] of the MultiPoint Forces. The results are due to applied limit loads.
| Load Case | FORWARD | INBOARD | OUTBOARD | UPWARD | DOWNWARD | ||||||
|---|---|---|---|---|---|---|---|---|---|---|---|
| Balloon No | ID | fshear | faxial | fshear | faxial | fshear | faxial | fshear | faxial | fshear | faxial |
| 10 | 6959 | 389.74 | 110.96 | 37.90 | 37.84 | 43.58 | -10.88 | 169.06 | 61.92 | 110.55 | -28.05 |
| 11 | 6958 | 133.07 | 39.73 | 12.74 | 12.34 | 28.88 | -1.78 | 54.82 | 34.82 | 51.43 | -15.86 |
| 12 | 6957 | 127.97 | -5.69 | 28.13 | 0.32 | 26.24 | 2.30 | 12.60 | 13.25 | 17.02 | -6.78 |
| 13 | 6948 | 127.10 | -53.84 | 17.88 | -10.50 | 15.13 | 7.20 | 43.19 | -5.20 | 27.79 | 0.82 |
Based on the table below, the maximum shear and axial forces carried by an ARM/4 (CR3212) rivet are 389.74 lbf and 110.96 lbf, respectively (LIMIT LOADS). These values belong to the forward load case. The minimum negative (maximum tensile) axial load belongs to the forward load case, and it has a value of 53.84 lbf.
In the forward load case, the shear load carried by rivet No. 10 is relatively high. Hence, a fail-safe evaluation is performed to assess the design’s ability to withstand localized fastener failure. In this way, the structural impact in the event of fastener’s absence or failure can be evaluated. In this evaluation, it was assumed that the shear and tensile loads originally carried by rivet No. 10 would be entirely transferred to the adjacent rivets in the same row, namely, rivet Nos. 11 to 13. The redistribution reflects the load-sharing behavior of riveted joints in practice, where neighboring fasteners compensate for the loss of load-bearing capacity in one element.
The updated MultiPoint Forces for these three rivets, after redistributing the load from rivet No. 10, are provided in the below table. The corresponding resultant shear and axial loads carried by each of these rivets following the redistribution are summarized in the table below.
The MultiPoint Forces [lbf]. The results are due to applied limit loads.
| Load Case | FORWARD | INBOARD | OUTBOARD | UPWARD | DOWNWARD | |||||||||||
|---|---|---|---|---|---|---|---|---|---|---|---|---|---|---|---|---|
| Balloon No | ID | fx | fy | fz | fx | fy | fz | fx | fy | fz | fx | fy | fz | fx | fy | fz |
| 11 | 6958 | 101.53 | 76.72 | -217.71 | -2.18 | 24.95 | 17.60 | -12.52 | -5.41 | -33.75 | -21.05 | 55.46 | -106.79 | 28.15 | -25.21 | 82.54 |
| 12 | 6957 | 129.46 | 31.30 | -133.54 | 17.80 | 12.93 | 11.31 | -17.26 | -1.33 | -22.19 | -8.67 | 33.89 | -65.08 | 17.68 | -16.13 | 48.16 |
| 13 | 6948 | 89.73 | -16.85 | -38.38 | 7.79 | 2.11 | 8.03 | -5.74 | 3.57 | -4.75 | 7.63 | 15.44 | -13.77 | 5.87 | -8.53 | 8.67 |
The resultant shear and axial forces components [lbf] of the MultiPoint Forces. The results are due to applied limit loads.
| Load Case | FORWARD | INBOARD | OUTBOARD | UPWARD | DOWNWARD | ||||||
|---|---|---|---|---|---|---|---|---|---|---|---|
| Balloon No | ID | fshear | faxial | fshear | faxial | fshear | faxial | fshear | faxial | fshear | faxial |
| 11 | 6958 | 240.23 | 76.72 | 17.73 | 24.95 | 35.99 | -5.41 | 108.84 | 55.46 | 87.21 | -25.21 |
| 12 | 6957 | 186.00 | 31.30 | 21.09 | 12.93 | 28.11 | -1.33 | 65.65 | 33.89 | 51.31 | -16.13 |
| 13 | 6948 | 97.60 | -16.85 | 11.19 | 2.11 | 7.45 | 3.57 | 15.74 | 15.44 | 10.47 | -8.53 |
The maximum shear and axial forces carried by an ARM/4 (CR3212) rivet are 240.23 lbf and 76.72 lbf, respectively (LIMIT LOADS). These values belong to the forward load case. This joint configuration (J8) has an ultimate shear and tensile strength values of fsu=582 lbf and ftu=228 lbf, respectively. Therefore, the minimum margin of safety of these rivets can be calculated as below:
→ PASS
→ PASS
AC Intercostal’s Fasteners
AC Intercostal – FWD Large Intercostal Clip and AFT Small Intercostal Clip
The AC Intercostal is fixed to the FWD and AFT Clips through BJ/4 (MS20470AD4) rivets at joints J18 and J21, respectively. The below table lists the CBUSH Forces at these rivets, and the table below lists the resultant shear and tensile forces.
The CBUSH Forces components in their local coordinate system [lbf]. The results are due to applied limit loads.
| Load Case | FORWARD | INBOARD | OUTBOARD | UPWARD | DOWNWARD | |||||||||||
|---|---|---|---|---|---|---|---|---|---|---|---|---|---|---|---|---|
| Balloon No | ID | fx | fy | fz | fx | fy | fz | fx | fy | fz | fx | fy | fz | fx | fy | fz |
| 1 | 4 | 0.00 | 0.15 | -0.27 | -0.04 | -1.84 | 5.30 | 0.00 | -0.12 | 0.30 | -0.09 | -4.67 | 13.54 | 0.00 | 0.51 | -0.59 |
| 2 | 7 | 0.00 | 0.02 | -0.24 | -0.04 | -0.02 | 5.35 | 0.00 | -0.01 | 0.30 | -0.09 | -0.04 | 13.64 | 0.00 | 0.13 | -0.58 |
| 3 | 8 | 0.00 | -0.07 | -0.15 | 0.07 | 1.70 | 5.36 | 0.00 | 0.09 | 0.31 | 0.17 | 4.33 | 13.67 | -0.01 | -0.16 | -0.60 |
| 4 | 9 | -0.02 | -0.12 | 0.03 | 0.01 | 4.18 | 5.48 | 0.00 | 0.24 | 0.32 | 0.02 | 10.66 | 13.99 | 0.00 | -0.50 | -0.62 |
| 5 | 10 | -0.09 | 14.26 | 21.91 | 0.03 | 10.52 | 13.12 | 0.00 | 1.10 | 1.51 | 0.10 | 26.53 | 32.90 | -0.02 | -0.74 | -0.63 |
| 6 | 11 | -0.42 | 1.00 | 10.48 | -0.35 | 0.45 | 8.19 | -0.04 | 0.06 | 0.84 | -0.89 | 1.11 | 20.67 | 0.03 | 0.00 | -0.61 |
| 7 | 12 | 0.82 | -14.95 | 5.35 | 0.64 | -10.65 | 6.01 | 0.07 | -1.14 | 0.54 | 1.61 | -26.82 | 15.26 | -0.04 | 0.69 | -0.59 |
The resultant shear and tensile forces components [lbf] of the CBUSH Forces. The results are due to applied limit loads.
| Load Case | FORWARD | INBOARD | OUTBOARD | UPWARD | DOWNWARD | ||||||
|---|---|---|---|---|---|---|---|---|---|---|---|
| Balloon No | ID | fshear | ftensile | fshear | ftensile | fshear | ftensile | fshear | ftensile | fshear | ftensile |
| 1 | 4 | 0.31 | 0.00 | 5.62 | -0.04 | 0.32 | 0.00 | 14.32 | -0.09 | 0.78 | 0.00 |
| 2 | 7 | 0.24 | 0.00 | 5.35 | -0.04 | 0.30 | 0.00 | 13.64 | -0.09 | 0.60 | 0.00 |
| 3 | 8 | 0.16 | 0.00 | 5.62 | 0.07 | 0.32 | 0.00 | 14.34 | 0.17 | 0.62 | -0.01 |
| 4 | 9 | 0.12 | -0.02 | 6.90 | 0.01 | 0.40 | 0.00 | 17.59 | 0.02 | 0.80 | 0.00 |
| 5 | 10 | 26.14 | -0.09 | 16.82 | 0.03 | 1.87 | 0.00 | 42.27 | 0.10 | 0.97 | -0.02 |
| 6 | 11 | 10.53 | -0.42 | 8.20 | -0.35 | 0.84 | -0.04 | 20.70 | -0.89 | 0.61 | 0.03 |
| 7 | 12 | 15.88 | 0.82 | 12.22 | 0.64 | 1.26 | 0.07 | 30.86 | 1.61 | 0.91 | -0.04 |
The maximum shear and tensile forces carried by the BJ/4 (MS20470AD4) rivets are 42.27 lbf and 1.61 lbf, respectively (LIMIT LOADS). These values belong to the upward load case. The joint configuration at J18 and J21 have an ultimate shear and tensile strength values of fsu=389 lbf and ftu=483 lbf, respectively. Therefore, the minimum margin of safety of these rivets can be calculated as below:
→ PASS
→ PASS
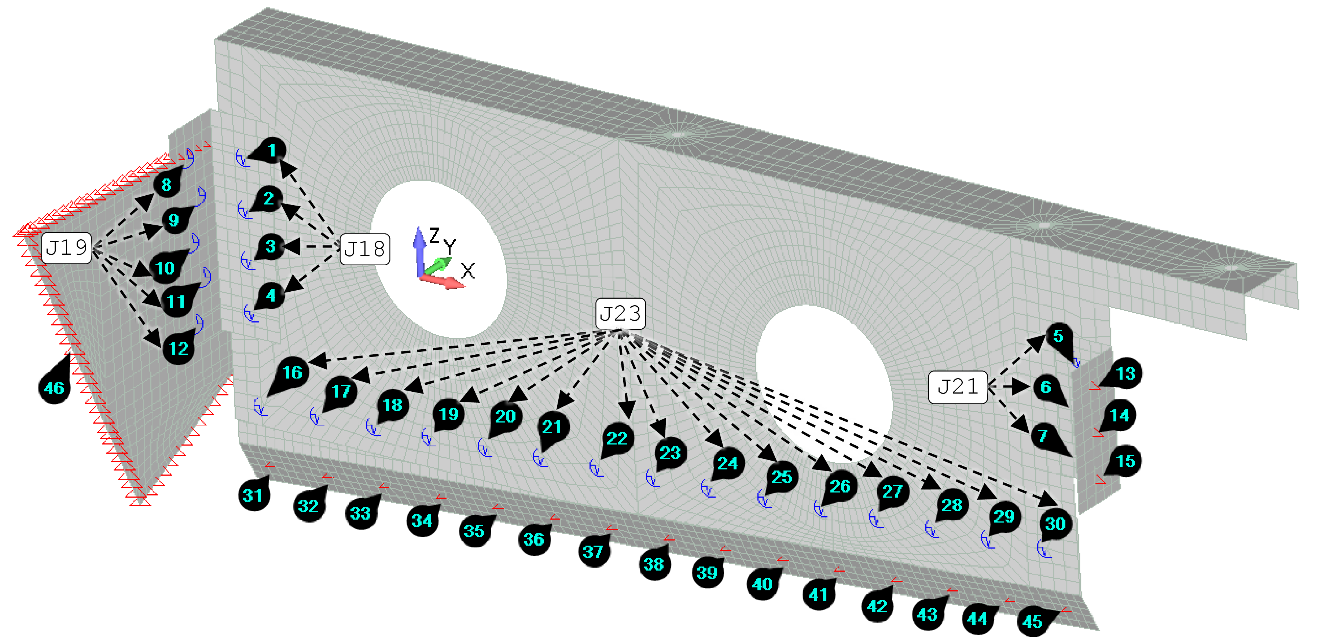
Doubler – OEM FWD Frame
The Doubler is fixed to the OEM FWD Frame through 23xBJ/4 (MS20470AD4) rivets. The below figure illustrates the Constraint Forces Components at the doubler’s edges and the sum of these forces in all load cases. The below table lists the sum of the Constraint Forces at the edges of the doubler, and the table below lists the resultant shear and tensile forces.
The Sum of the Constraint Forces components [lbf]. The results are due to applied limit loads.
| Load Case | FORWARD | INBOARD | OUTBOARD | UPWARD | DOWNWARD | |||||||||||
|---|---|---|---|---|---|---|---|---|---|---|---|---|---|---|---|---|
| Balloon No | ID | fx | fy | fz | fx | fy | fz | fx | fy | fz | fx | fy | fz | fx | fy | fz |
| 46 | n/a | -0.03 | 0.02 | 0.63 | 4.01 | -0.14 | -21.49 | 0.21 | -0.01 | -1.23 | 10.27 | -0.35 | -54.85 | -0.03 | 0.01 | 2.39 |
The resultant shear and tensile forces components [lbf] of the Constraint Forces. The results are due to applied limit loads.
| Load Case | FORWARD | INBOARD | OUTBOARD | UPWARD | DOWNWARD | ||||||
|---|---|---|---|---|---|---|---|---|---|---|---|
| Balloon No | ID | fshear | ftensile | fshear | ftensile | fshear | ftensile | fshear | ftensile | fshear | ftensile |
| 46 | n/a | 0.63 | 0.03 | 21.49 | -4.01 | 1.23 | -0.21 | 54.85 | -10.27 | 2.39 | 0.03 |
The maximum shear and tensile forces carried by all BJ/4 (MS20470AD4) rivets are 54.85 lbf and 0.03 lbf, respectively (LIMIT LOADS). These values belong to the upward and downward load cases, respectively, and it will be distributed over 23 rivets. Therefore, these rivets pass by observation.
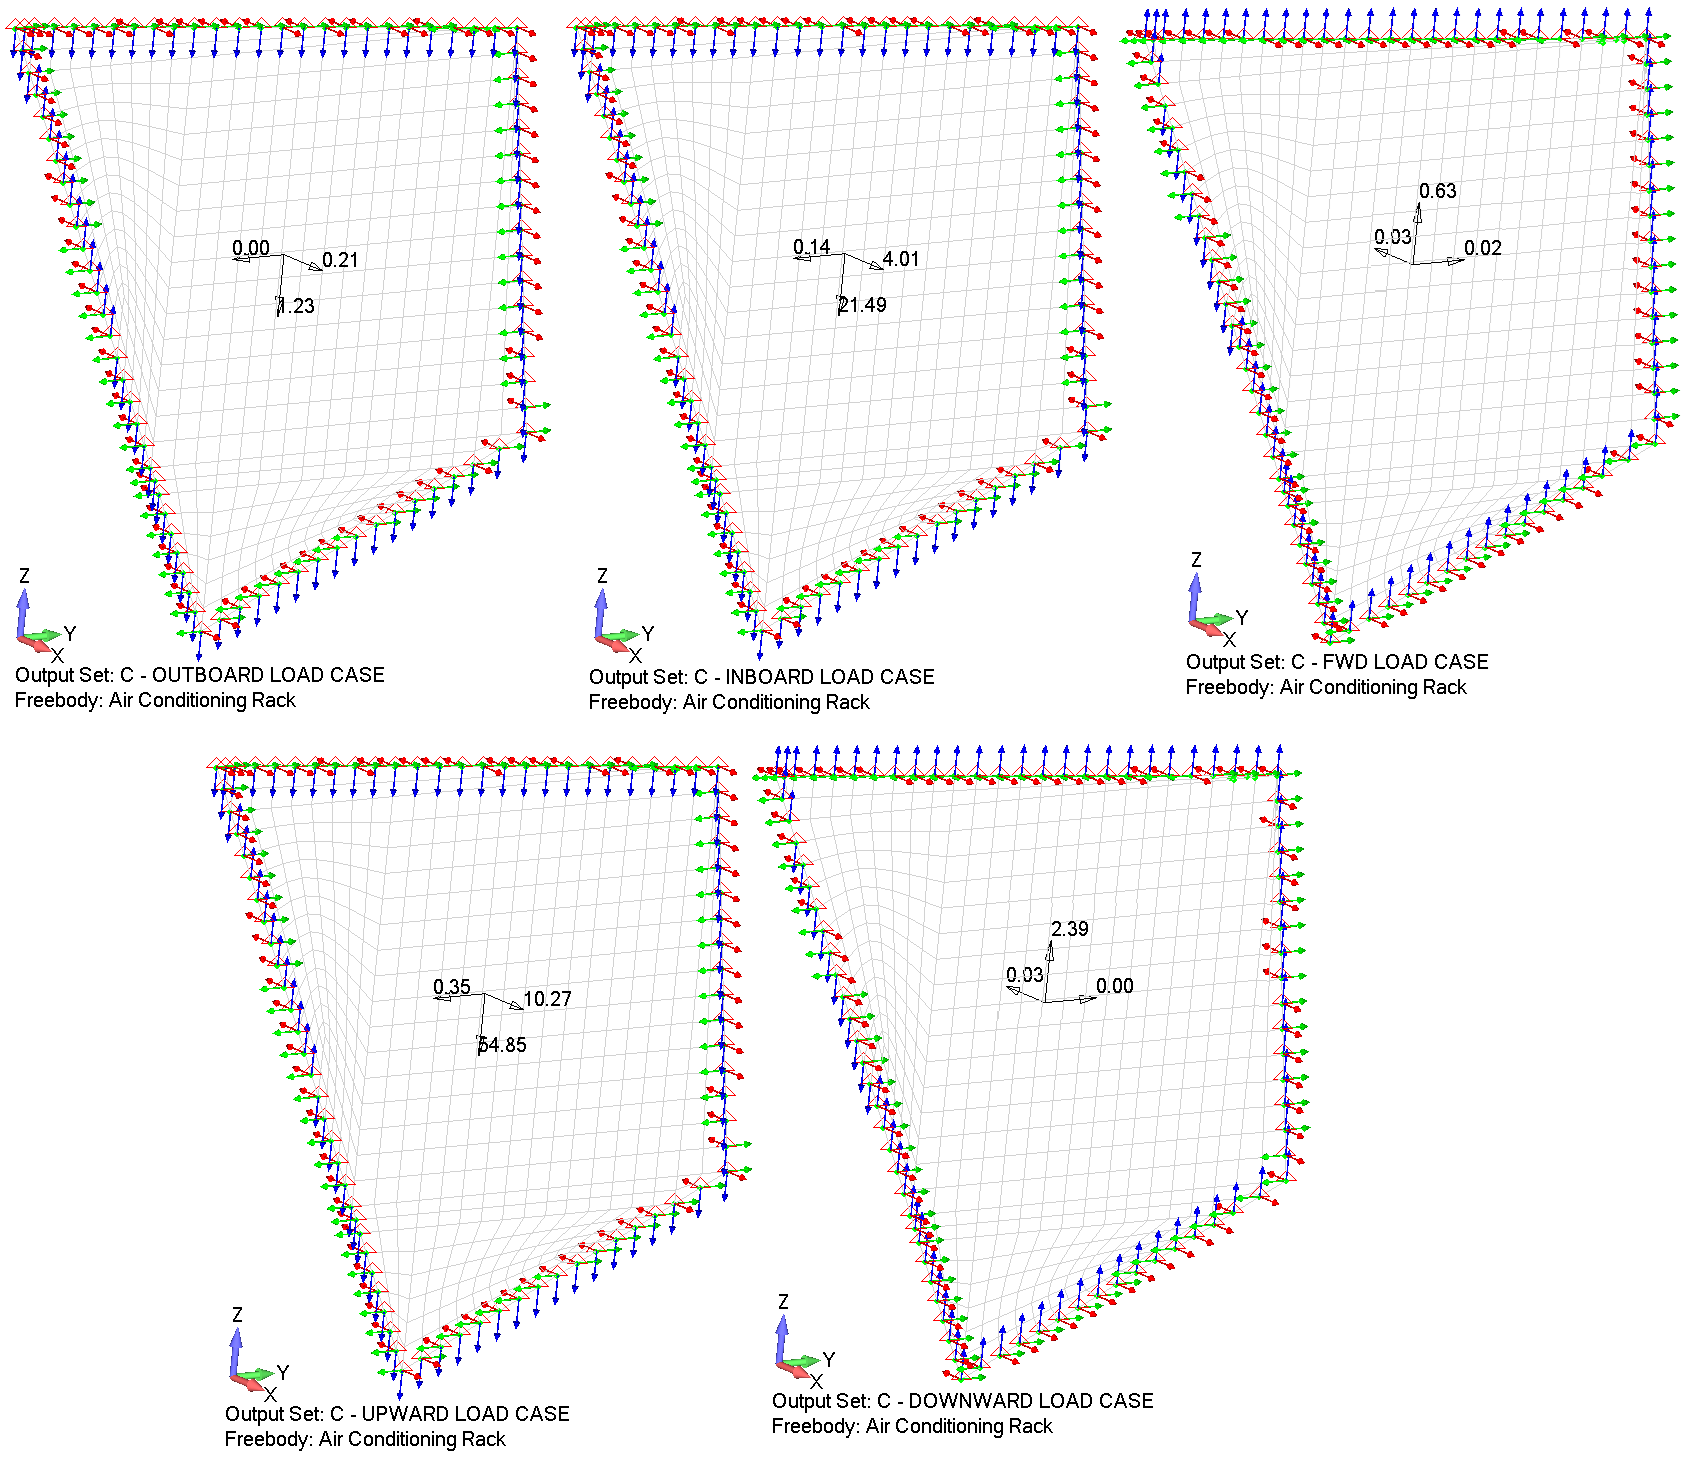
The acceptability of the loads introduced into the existing aircraft structure has been confirmed on the basis that the existing structure was designed, analysed, and tested to meet FAR/Part 25 and applicable OEM allowables with sufficient margins. The introduced loads are less severe than those already accounted for in the original OEM analysis. Therefore, the redistributed loads remain within the capacity of the existing structure, and no adverse impact on its structural integrity is expected.
REFERENCES
Structural Methods & Allowables
- MMPDS-15 - Metallic Materials Properties Development and Standardization
- Analysis and Design of Flight Vehicle Structures - E. F. Bruhn
- Roark’s Formulas for Stress and Strain
- Aluminum Design Manual 2010
- Stress Analysis Manual - Air Force Flight Dynamics Laboratory, Wright-Patterson
- Fastener Design Manual - NASA Reference Publication 1228
Regulatory & Aircraft Load Basis
- Federal Aviation Regulations - 14 CFR Part 25
- DHC-8-100 Load Cases and Applied Loads
Fasteners & Hardware Data
- CherryMax Rivets technical data
- NAS528 Fastener Codes
- MS24694 technical data
- NASM3-20 aircraft-bolt technical data
Track & Fitting Data
- FE200744 stud-fitting technical data
- FE748-01-PD4 aircraft-track technical data
- ANCRA Aircraft Track technical data