Introduction
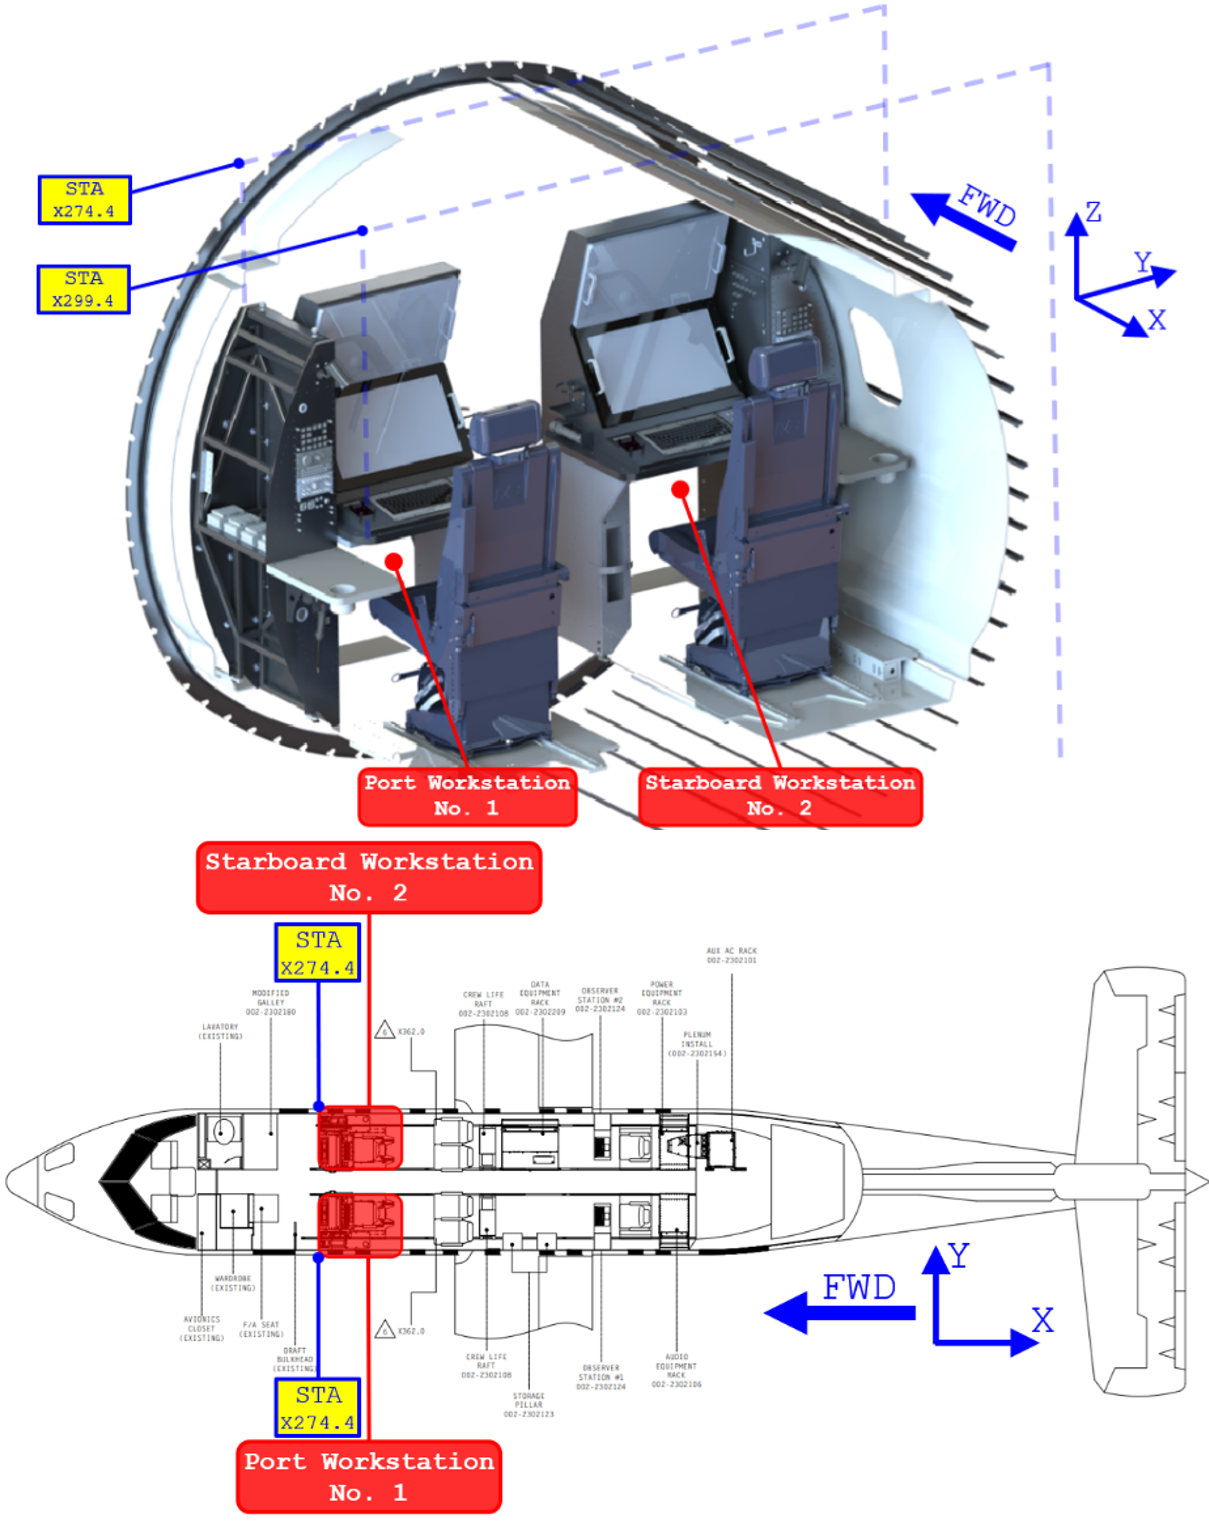
Port and Starboard workstation installations on the DHC-8-100, including primary structure, equipment support provisions and aircraft attachments.
Critical inertia cases are applied to the installed mass and checked through FEM and targeted classical substantiation.
Member stresses, stability modes, joints, panels, composite supports and attachment reactions are compared with applicable allowables.
Design Assessment
Governing configuration. Port and Starboard layouts are identical over X274.4–X299.4 and therefore share the same vertical acceleration environment. The Starboard workstation carries the greater equipment mass, so it governs the structural substantiation; the Port side is covered by comparison.
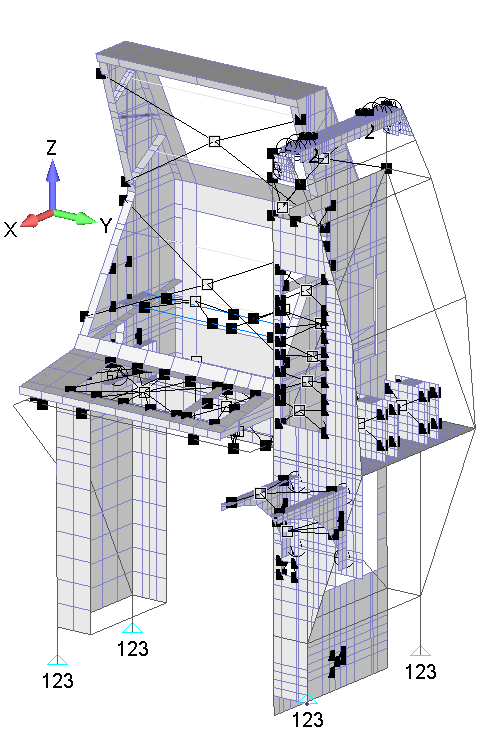
I used the heavier Starboard workstation as the governing configuration and retained the complete structural load path from equipment inertia to the aircraft attachments. Equipment and composite-table masses are introduced through RBE3 elements so their inertia is distributed without artificial stiffness; beam and plate elements then carry the loads through the tube frame, skins, braces, gussets, and attachment fittings. The lower seat-track studs provide the primary translational restraint, while the upper attachments restrain lateral and longitudinal motion but leave vertical translation free. This avoids creating an artificial upper vertical load path while preserving the physical support kinematics.
General Layout
The Starboard Workstation consists of:
Tube Structure
Monitor Bracket Assembly
Workstation Desk Assembly
Workstation Tower Assembly
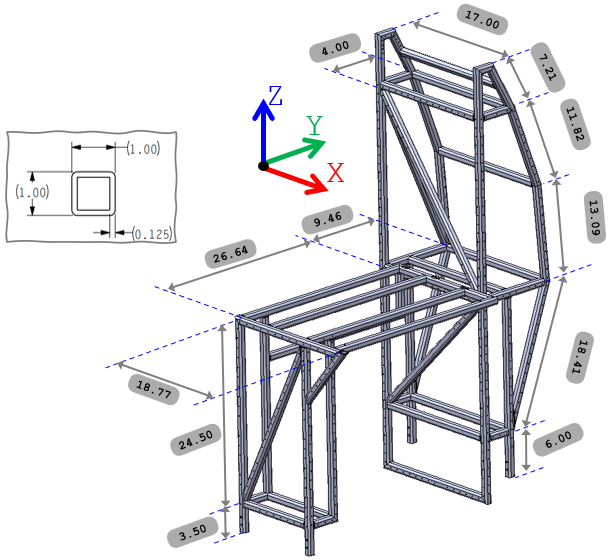
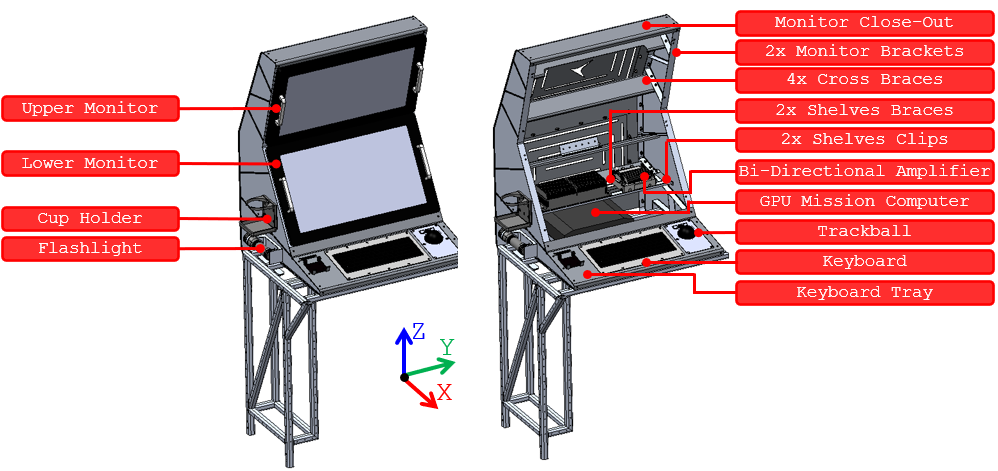
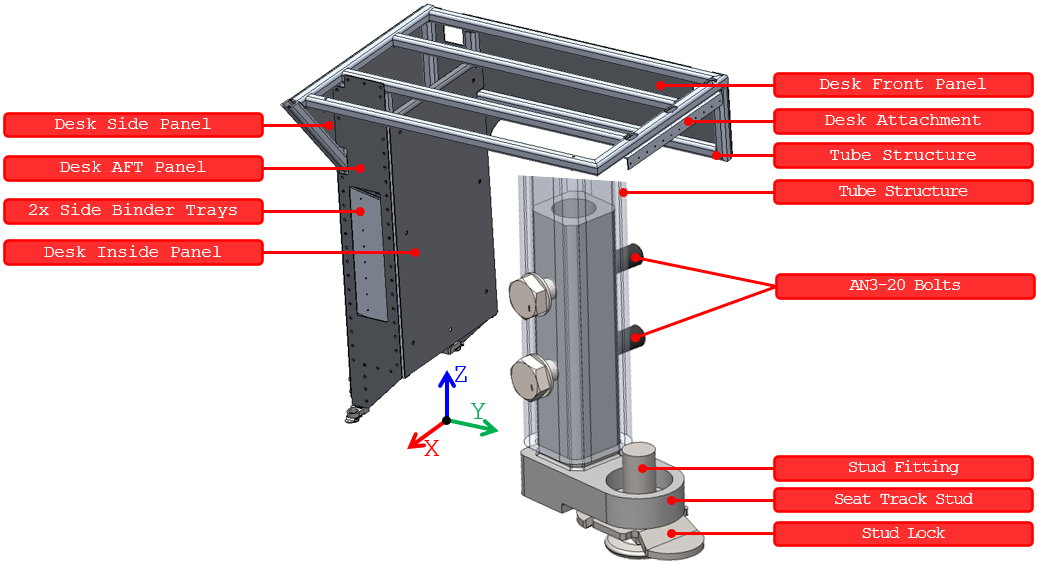
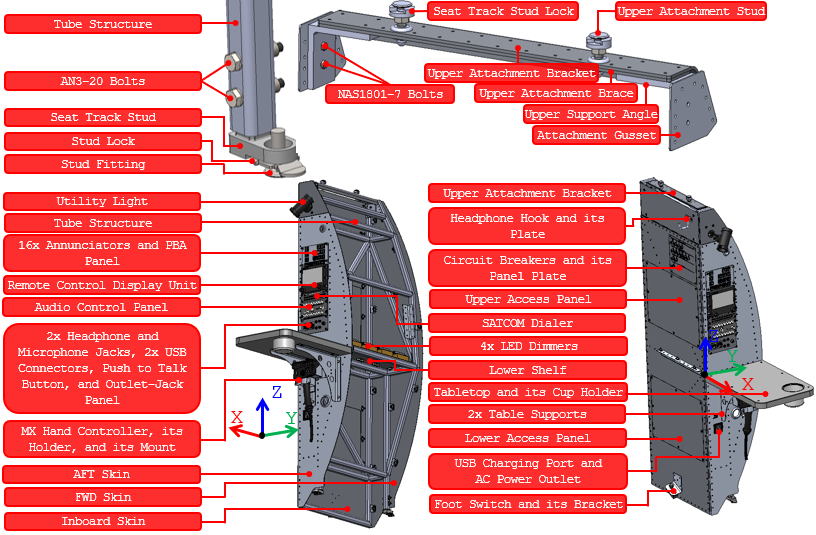
Workstation Components
As shown in the previous section, the Starboard Workstation is composed of several structural components, each precisely connected at designated points using multiple fasteners to ensure optimal load distribution and rigidity. These components, critical to the overall integrity of the installation, are outlined in the applicable table along with the materials and thicknesses used.
The main structural components along with their material and thickness properties
| Component Name | Thickness [in] |
Material |
|---|---|---|
| FWD Skin Panel | 0.032 | AL 2024-T3 ALCLAD Sheet |
| Upper and Lower Access Panels | ||
| Hand Controller Mount | ||
| Binder Tray Sides, End, and Clips | 0.04 | |
| Two Foot Clips | 0.04 | |
| Desk Attachment Brace | 0.05 | |
| Two Grounding Bracket | 0.0625 | |
| Two Table Supports | ||
| AFT Access Panel | ||
| Two Attachment Gussets | ||
| Inside Desk Panel | ||
| Keyboard Tray | ||
| Monitor Close-Out | ||
| Four Cross Braces | ||
| Top and Lower Monitor Close-Outs | ||
| Two Shelf Clips | ||
| Inboard and AFT Skin | 0.071 | |
| Top Access Panel | ||
| Desk Side, AFT, and Front Panels | ||
| Upper Attachment Bracket and Brace | 0.125 | |
| Two Monitor Brackets | 0.063 | AL 2024-T351 Plate |
| Four Seat Track Stud | 1 | |
| Workstation Tower Tube Structure Port | 0.125 | AL 6061-T6 Extrusion |
| Workstation Desk Tube Structure | ||
| Load Spreaders | ||
| Two Upper Support Angles | 0.25 | |
| Two Shelf Braces | 0.063 | |
| Desk Attachment | 0.063 | AL 6061-T6511 Extrusion |
| Twenty CAMLOC Clips | ||
| Seven CAMLOC Clips | ||
| Table Attachment Clip | 0.125 | |
| Four Slides | 0.125 | KYDEX 100 |
| Neoprene | 0.0625 | NEOPRENE |
| Two Tabletops | 1 | TEKLAM AA207-66-1000A |
| Two Tabletops | 0.125 | LEXAN 9604 |
Workstation Weight Estimation
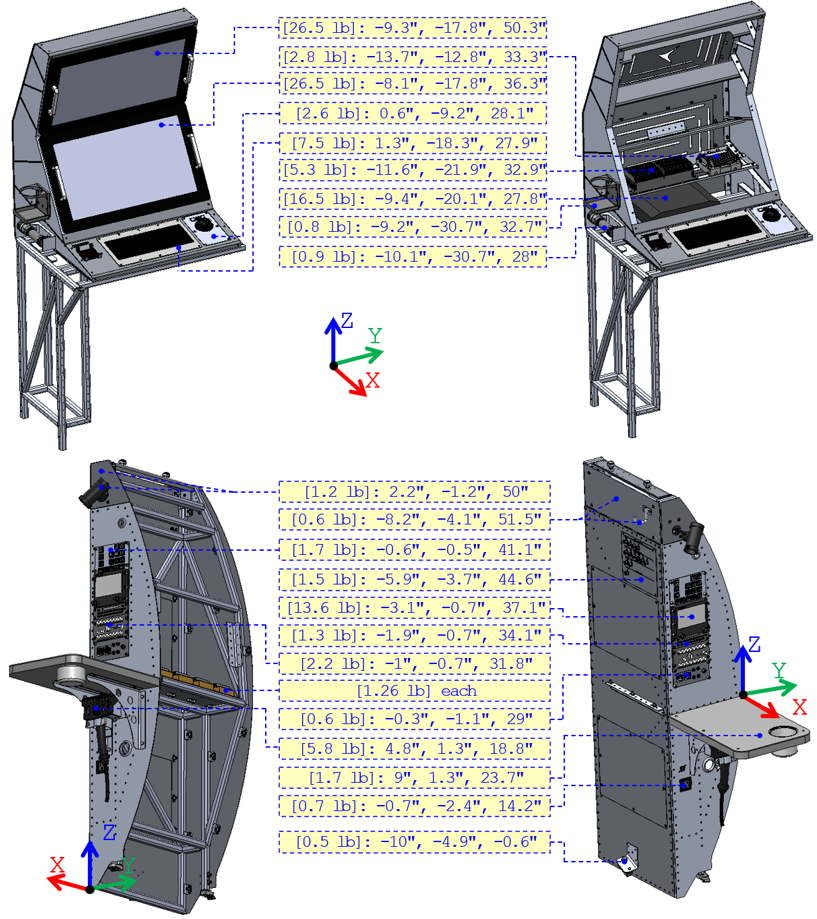
Load-bearing geometry remains in the FEM. Equipment is represented by concentrated mass at its CoG so inertia enters the correct location without unnecessary geometric detail.
Al 2024 sheet/plate density: 0.100 lb/in³
Al 6061 extrusion density: 0.098 lb/in³
Modeled Structural Components’ Volumes and Weights on the Starboard Workstation
| Component | Volume [in3] |
Material | Weight [lb] |
CoG [in] |
||
|---|---|---|---|---|---|---|
| X | Y | Z | ||||
| Workstation Tower Tube Structure Port | 214.47 | AL 6061-T6 Extrusion | 21.02 | -9.39 | -0.64 | 26.59 |
| Workstation Desk Tube Structure | 130.80 | 12.82 | -7.15 | -23.94 | 17.44 | |
| Two Upper Support Angles | 4.55 | 0.45 | -9.00 | -2.87 | 53.73 | |
| Two Shelf Braces | 3.86 | 0.38 | -11.59 | -18.40 | 31.80 | |
| Desk Attachment | 1.64 | AL 6061-T6511 Extrusion | 0.16 | -7.00 | -4.76 | 24.24 |
| Two Monitor Brackets | 62.22 | AL 2024-T351 Plate | 6.22 | -11.14 | -18.37 | 36.55 |
| Monitor Close-Out | 32.96 | AL 2024-T3 ALCLAD Sheet | 3.30 | -14.98 | -18.37 | 44.47 |
| Keyboard Tray | 9.56 | 0.96 | 1.00 | -19.28 | 28.37 | |
| Four Cross Braces | 20.19 | 2.02 | -14.47 | -18.37 | 41.15 | |
| Two Shelf Clips | 0.94 | 0.09 | -11.59 | -18.37 | 31.63 | |
| Two Attachment Gussets | 1.07 | 0.11 | -9.00 | -2.77 | 53.13 | |
| Two Table Supports | 5.38 | 0.54 | 3.67 | 1.46 | 20.59 | |
| Lower Shelf | 8.18 | 0.82 | -8.85 | 3.23 | 24.53 | |
| Two LED Dimmer Brackets | 6.92 | 0.69 | -9.00 | 3.25 | 27.16 | |
| Upper Attachment Bracket | 6.16 | 0.62 | -9.00 | -2.27 | 54.46 | |
| Desk Side, AFT, and Front Panels | 53.78 | 5.38 | -9.25 | -28.37 | 13.92 | |
| Inboard and AFT Skin | 69.09 | 6.91 | -5.44 | -2.34 | 21.56 | |
| TOTAL | 62.49 | -8.83 | -11.62 | 25.98 | ||
Composite Shelves’ Volumes and Weights on the Starboard Workstation
| Component | Volume [in3] |
Material | Weight [lb] |
CoG [in] |
||
|---|---|---|---|---|---|---|
| X | Y | Z | ||||
| Side Table | 197.624 | TEKLAM AA207-66-1000A | 1.70 | 9.04 | 1.25 | 23.67 |
| Side Table Cover | 24.53 | LEXAN 9604 | ||||
| Table Top | 608.78 | TEKLAM AA207-66-1000A | 2.59 | -3.58 | -19.37 | 26.22 |
| Table Top Cover | 17.12 | LEXAN 9604 | ||||
| TOTAL | 4.29 | 1.42 | -11.20 | 25.21 | ||
The weights of the Modeled Structural Components and the composite shelves were generated from the 3D model The weights of the equipment are based on their corresponding manufacturer data sheet, and their CoG locations were generated from the 3D model. It is noteworthy an additional estimated weight (1.5 times the equipment weight) has been added to each equipment to account for the weight of the hardware and wires/cables installed.
Equipment Weights and their CoG locations on the Starboard Workstation
| Equipment | Weight [lb] |
Scaled Weight [lb] |
Qty | Total Weight [lb] |
CoG [in] |
||
|---|---|---|---|---|---|---|---|
| X | Y | Z | |||||
| Bi-Directional Amplifier | 5.00 | 5.25 | 1 | 5.25 | -11.62 | -21.87 | 32.90 |
| LOS Radio | 2.50 | 2.75 | 1 | 2.75 | -13.67 | -12.82 | 33.32 |
| Mission Computer | 11.02 | 16.53 | 1 | 16.53 | -10.30 | -20.24 | 28.07 |
| LED Dimmers | 0.84 | 1.26 | 1 | 1.26 | -4.00 | 3.25 | 27.59 |
| LED Dimmer | 0.84 | 1.26 | 1 | 1.26 | -7.35 | 3.25 | 27.59 |
| LED Dimmer | 0.84 | 1.26 | 1 | 1.26 | -10.66 | 3.25 | 27.59 |
| LED Dimmer | 0.84 | 1.26 | 1 | 1.26 | -14.00 | 3.25 | 27.59 |
| Utility Light | 0.70 | 1.05 | 1 | 1.24 | 2.78 | -1.22 | 49.95 |
| AFT Access Panel | 0.19 | 0.19 | 1 | ||||
| Hand Controller Holder | 0.50 | 0.75 | 1 | 5.80 | 4.81 | 1.26 | 18.79 |
| MX Hand Controller | 3.31 | 4.96 | 1 | ||||
| Under Table Hand Controller Mount | 0.09 | 0.09 | 1 | ||||
| AC Power Outlet | 0.30 | 0.45 | 1 | 0.65 | -0.17 | -2.38 | 14.20 |
| USB Charging Port | 0.13 | 0.20 | 1 | ||||
| Circuit Breaker | 0.06 | 0.09 | 13 | 1.51 | -5.90 | -4.28 | 44.57 |
| Circuit Breaker Panel Plate | 0.34 | 0.34 | 1 | ||||
| Headphone Hook and its plate | 0.13 | 0.2 | 1 | 0.56 | -8.21 | -4.60 | 51.53 |
| Top Access Panel | 0.36 | 0.36 | 1 | ||||
| Foot Switch | 0.25 | 0.38 | 1 | 0.46 | -9.99 | -5.44 | -0.60 |
| Foot Switch Bracket | 0.09 | 0.09 | 1 | ||||
| Upper Display | 17.64 | 26.46 | 1 | 26.46 | -9.28 | -18.37 | 50.29 |
| Lower Display | 17.64 | 26.46 | 1 | 26.46 | -8.05 | -18.37 | 36.32 |
| Keyboard Panel Mount | 5.00 | 7.50 | 1 | 7.50 | 1.31 | -18.87 | 27.93 |
| Trackball | 1.76 | 2.64 | 1 | 2.64 | 0.57 | -9.71 | 28.05 |
| Adjustable Ring Cup Holder | 0.50 | 0.75 | 1 | 0.75 | -9.21 | -31.25 | 32.72 |
| Flashlight | 0.61 | 0.92 | 1 | 0.92 | -10.11 | -31.21 | 28.04 |
| DZUS Rail | 0.19 | 0.19 | 2 | 0.56 | N/R | N/R | N/R |
| DZUS Rail Mount | 0.18 | 0.18 | 1 | ||||
| TYPE III Annunciator | 0.06 | 0.09 | 16 | 1.66 | -0.09 | -0.54 | 41.08 |
| PBA Panel | 0.11 | 0.11 | 1 | ||||
| Remote Control Display Unit | 9.00 | 13.50 | 1 | 13.61 | -2.52 | -0.69 | 37.07 |
| SATCOM Dialer | 0.80 | 1.20 | 1 | 1.31 | -1.34 | -0.69 | 34.08 |
| Audio Control Panel | 1.42 | 2.13 | 1 | 2.24 | -0.47 | -0.68 | 31.83 |
| USB Connectors | 0.07 | 0.11 | 2 | 0.55 | 0.28 | -1.13 | 28.99 |
| Headphone/Microphone Jacks | 0.01 | 0.02 | 4 | ||||
| Push to Talk Button | 0.04 | 0.07 | 1 | ||||
| Outlet-Jack Panel | 0.10 | 0.10 | 1 | ||||
| TOTAL | 127.14 | -6.62 | -13.70 | 36.03 | |||
Moreover, the Non-Structural Exterior Removable Panels, the Non-Structural Assembly Parts, and small Equipment Units/Parts were omitted from the analysis. However, to account for effect, the total weight of these components will be added to the FE model as a non-structural mass distributed over the tube structure. The table below lists these components along with their weights.
Unmodeled Nonstructural Components’ Volumes and Weights on the Starboard Workstation
| Component | Volume [in3] |
Material | Weight [lb] |
CoG [in] |
||
|---|---|---|---|---|---|---|
| X | Y | Z | ||||
| FWD Skin Panel | 16.37 | AL 2024-T3 ALCLAD Sheet | 1.64 | -18.52 | 0.54 | 26.25 |
| Upper and Lower Access Panels | 12.10 | 1.21 | -9.00 | -4.59 | 23.62 | |
| Binder Tray Sides, End, and Clips | 14.94 | 1.49 | -6.78 | -29.72 | 7.51 | |
| Two Foot Clips | 0.35 | 0.04 | -8.00 | -30.96 | -0.97 | |
| Desk Attachment Brace | 1.19 | 0.12 | -7.14 | -4.56 | 24.52 | |
| Two Grounding Bracket | 1.73 | 0.17 | -16.14 | -6.41 | 34.68 | |
| Inside Desk Panel | 17.36 | 1.74 | -7.97 | -27.19 | 11.60 | |
| Top and Lower Monitor Close-Outs | 26.28 | 2.63 | -16.87 | -18.37 | 41.82 | |
| Upper Attachment Brace | 3.38 | 0.34 | -9.00 | -2.86 | 54.52 | |
| Hand Controller Mount | 0.2585 | 0.03 | 0.77 | -28.17 | 28.46 | |
| Four Seat Track Studs | 6.95 | AL 2024-T351 Plate | 0.70 | -8.50 | -15.85 | -0.73 |
| Twenty CAMLOC Clips | 2.10 | AL 6061-T6511 Extrusion | 0.54 | -4.94 | -18.64 | 25.35 |
| Seven CAMLOC Clips | 0.74 | |||||
| Table Attachment Clip & Load Spreaders | 2.69 | |||||
| Four Slides | 6.65 | KYDEX 100 | 0.32 | -5.03 | -5.57 | -3.66 |
| Neoprene | 0.26 | NEOPRENE | 0.012 | 0.77 | -28.17 | 28.50 |
| Fasteners, Nuts, Washers, … etc. | 11.80 | AL 2024-T351 Plate | 1.18 | -8.02 | -10.22 | 29.67 |
| TOTAL | 12.16 | -11.21 | -15.17 | 23.72 | ||
Summary of Structural, Nonstructural, and Equipment Weights on the Starboard Workstation
| Component | Weight [lb] |
CoG [in] |
||
|---|---|---|---|---|
| X | Y | Z | ||
| Structural Components | 62.49 | -8.83 | -11.62 | 25.98 |
| Nonstructural Components | 12.16 | -11.21 | -15.17 | 23.72 |
| Equipment | 127.14 | -6.62 | -13.70 | 36.03 |
| Composite shelves | 4.29 | 1.42 | -11.20 | 25.21 |
| TOTAL | 206.08 | -7.39 | -13.10 | 32.03 |
A worked check for the X-coordinate is:
The same procedure produces and .
Material Properties
Material properties used in the Starboard Workstation [MMPDS-15-Table 3.6.2.0(g), Table 3.2.4.0(c1), Table 3.2.4.0(b2)].
AL 6061-T6 and T6511 Extrusion t≤1” |
AL 2024-T3 CLAD Sheet t=0.063” – 0.128” |
AL 2024-T351 Plate t=0.5” – 1” |
Unit | |
|---|---|---|---|---|
| Ftu | 38 | 62 | 63 | ksi |
| Fty | 35 | 45 | 48 | ksi |
| Fcy | 34 | 37 | 39 | ksi |
| Fsu | 26 | 38 | 37 | ksi |
| Fbru | 82 | 125 | 117 | ksi |
| Fbry | 60 | 84 | 90 | ksi |
| E x103 | 9.90 | 10.50 | 10.7 | ksi |
| Ec x103 | 10.10 | 10.70 | 10.9 | ksi |
| μ | 0.33 | 0.33 | 0.33 | - |
| ρ | 0.098 | 0.1 | 0.1 | lbm/in3 |
| G x103 | 3.80 | - | 4 | ksi |
| e | 10 | 15 | 8 | % |
Fasteners Allowables
Use the weakest applicable failure path for the actual fastener / sheet stack rather than the isolated fastener strength.
CR3212 Rivets
- Blind countersunk rivet · AL 5056
- Nominal / hole diameter: 0.125 / 0.1285 in
- Material shear allowable: Fsu = 50 ksi
- Single-shear capacity: fsu = 664 lbf
- Reference tensile capacity: ftu = 285 lbf
CR3212 Rivets’ list of properties [Technical Data Sheet-Cherrymax Rivets, MMPDS-15-Table 8.1.2(a), Table 8.1.2(b), Table 8.1.1.2, Table 8.1.5(a), Table 8.1.5(b2), Analysis and Design of Flight Vehicle Structures-Bruhn-Table D1.7]
| P/N | Type | Head | Size (Callout) |
Material | (Dr)(Dn) [in] |
(Fsu)(Ftu) for fastener material [ksi] |
(fsu)(ftu) for fastener in single shear [lbf] |
|---|---|---|---|---|---|---|---|
| CR3212 | Blind Rivet | CSK | ARM4 | AL 5056 | (0.125)(0.1285) | (50)(-) | (664)(285) |
The CR3212 rivets utilised in the AFT, FWD, and Side desk panels, and the ones utilised in the Inboard and AFT Tower Skin Panels both pass through:
0.071” thick AL 2024-T3 ALCLAD Sheet (the panels)
0.125” thick AL 6061-T6 Extrusion (the tube structure)
Rivet’s Shear Strength:
The joint’s shear strength using the CSK sheet thickness is 437x(50/51) = 428 lbf [MMPDS-15-Table 8.1.3.2.2(v)]. It is noteworthy that the values in [MMPDS-15-Table 8.1.3.2.2(v)] are for Fsu=51 ksi, so the joint’s shear strength was scaled down by a factor of 50/51.
Joint Bearing strength:
The non-CSK sheet is thicker than the CSK sheet in this joint. Therefore, calculating the joint ultimate bearing strength is not required.
Rivet’s Tensile Strength:
The tensile strength value of ftu=285 lbf is based on 0.156” thick CSK sheet [Technical Data Sheet-Cherrymax Rivets]. Therefore, the estimated tensile strength in this configuration is (0.071/0.156) x 285 = 129 lbf.
CR3213 Rivets
- Blind protruding-head rivet · AL 5056
- Nominal / hole diameter: 0.125 / 0.1285 in
- Material shear allowable: Fsu = 50 ksi
- Single-shear capacity: fsu = 664 lbf
- Reference tensile capacity: ftu = 285 lbf
CR3212 Rivets’ list of properties [Technical Data Sheet-Cherrymax Rivets, MMPDS-15-Table 8.1.2(a), Table 8.1.2(b), Table 8.1.1.2, Table 8.1.5(a), Table 8.1.5(b2), Analysis and Design of Flight Vehicle Structures-Bruhn-Table D1.7]
| P/N | Type | Head | Size (Callout) |
Material | (Dr)(Dn) [in] |
(Fsu)(Ftu) for fastener material [ksi] |
(fsu)(ftu) for fastener in single shear [lbf] |
|---|---|---|---|---|---|---|---|
| CR3213 | Blind Rivet | Protruded | ARN4 | AL 5056 | (0.125)(0.1285) | (50)(-) | (664)(285) |
The CR3213 utilised in the Attachment Gussets and in the Lower Shelf pass through
0.0625” thick AL 2024-T3 ALCAD Sheet
0.125” thick AL 6061-T6 Extrusion
Rivet’s Shear Strength:
The rivets in this configuration are in singe shear state and have Dr/tmin = 2 < 3. Therefore, no correction factor, , is needed, and the ultimate shear strength remains As shown in the corresponding table, namely, fsu=664 lbf.
The Static Joint Strength of this rivet in the current configuration (using the thinnest sheet thickness) is fsu=492*(50/51)=482 lbf [MMPDS-15-Table 8.1.3.1.2(p)]. It is noteworthy that the values in [MMPDS-15-Table 8.1.3.1.2(p)] are for Fsu=51 ksi, so the joint’s shear strength was scaled down by a factor of 50/51.
Joint Bearing strength:
The thinnest sheet in this joint is AL 2024-T3 ALCLAD that has an ultimate bearing strength of 125 ksi (Referencing the applicable table). Hence, the joint’s ultimate bearing strength is 810x(125/100)= 1,012 lbf [MMPDS-15-Table 8.1.2.1(a)]
Since the Static Joint Strength is smaller than the Joint Bearing Strength, the former will be considered as the joint allowable.
Rivet’s Tensile Strength:
The tensile strength value of ftu=285 lbf is based on 0.156” thick CSK sheet [Technical Data Sheet-Cherrymax Rivets]. Therefore, the estimated tensile strength in this configuration is (0.0625/0.156) x 285 = 114 lbf.
MS20426AD Rivets
- Solid countersunk rivet · AL 2117-T3
- Nominal / hole diameter: 0.125 / 0.1285 in
- Material shear allowable: Fsu = 30 ksi
- Single-shear capacity: 389 lbf
MS20426AD Rivets’ list of properties [Technical Data Sheet-NAS528 Fastener Codes, MMPDS-15-Table 8.1.2(a), Table 8.1.2(b), Table 8.1.1.2, Table 8.1.5(a), Table 8.1.5(b2), Analysis and Design of Flight Vehicle Structures-Bruhn-Table D1.7]
| P/N | Type | Head | Size (Callout) |
Material | (Dr)(Dn) [in] |
(Fsu)(Ftu) for fastener material [ksi] |
(fsu)(ftu) for fastener in single shear [lbf] |
|---|---|---|---|---|---|---|---|
| MS20426AD4 | Solid Rivet | CSK | BB4 | AL 2117-T3 | (0.125)(0.1285) | (30)(-) | (389)(-) |
The MS20426AD4 utilised to attach the shelf clips to the monitor brackets pass through
0.0625” AL 2024-T3 ALCAD Sheet (shelf clips)
0.063” thick AL 2024-T351 Plate (Monitor Bracket)
Rivet’s Shear Strength:
Based on the applicable data, the MS20426AD4 rivets have a single shear strength value of 389 lbf. In order to take into account the reduction in rivet shear strength when it is inserted in a sheet, the Static Joint Strength must be considered. Based on [MMPDS-15-Table 8.1.2.2(r)], the Static Joint Strength for this rivet is fsu=463 x (30/41) x (0.0625/0.063)=336 lbf. It is noteworthy that the values in [MMPDS-15-Table 8.1.2.2(r)] are for Fsu=41 ksi and for 0.063” sheet thickness, so the joint’s shear strength was scaled down by a factor of (30/41)x(0.0625/0.063).
Joint Bearing strength:
Since the countersunk sheet (AL 2024-T3 ALCAD Sheet) is thinner than the non- countersunk sheet, calculating the Joint Bearing strength is not required.
Rivet’s Tensile Strength:
The Ultimate Tensile Strength for 1/8” diameter AN426 (MS20426) Flush Head Rivet in 0.064” thick AL 2024 ALCAD Sheet is 438 lbf [Analysis & Design of Flight Vehicle Structures by Bruhn-Page 952]. In this joint, the thinnest sheet thickness is 0.0625” which yields to a smaller Ultimate Tensile Strength value for the rivet. Therefore, the value in [Analysis & Design of Flight Vehicle Structures by Bruhn-Page 952] can be scaled down as follows: ftu=438 x(0.0625/0.064)=427 lbf.
MS24693 Screws
- #6-32 and #8-32 countersunk screws
- Cadmium-plated carbon steel
- Ftu = 55 ksi
- Fsu = 33 ksi
- Tensile capacities: 545 / 840 lbf
MS24693 Screws’ list of properties [Technical Data Sheet-MS24693, MMPDS-15-Table 9.7.1.1, Table 8.1.1.2, Table 8.1.2(b), Table 8.1.5(a), Table 8.1.5(b1), Table 8.1.5(b2), Analysis and Design of Flight Vehicle Structures by Bruhn-Table D1.7]
| P/N | Type | Head | Size (Callout)(Thread)(Length) |
Material | Ds [in] |
(Fsu)(Ftu) for fastener material [ksi] |
(fsu)(ftu) for fastener in single shear [lbf] |
Thread Standard |
|---|---|---|---|---|---|---|---|---|
| MS24693-S28 | Screw | CSK | (#6-32)(UNC-2A)(0.5) | Cadmium Plated Carbon Steel | 0.138 | (0.6x55)(55) | (-)(545) | MIL-S-7742 |
| MS24693-S50 | Screw | CSK | (#8-32)(UNC-2A)(0.5) | Cadmium Plated Carbon Steel | 0.164 | (0.6x55)(55) | (-)(840) | MIL-S-7742 |
The #6-32 MS24693-S28 Screw utilised to mount the Keyboard pass through
The keyboard Panel Mount Flange
0.0625” thick AL 2024-T3 ALCAD Sheet (Keyboard Tray).
Screw’s Shank Shear Strength:
the Ultimate Single Shear Strength of the screw is fsu=523x(33/35)=493 lbf [MMPDS-15-Table 8.1.5(a)]
Joint Bearing strength:
The thinnest sheet in this joint is AL 2024-T3 ALCLAD that has an ultimate bearing strength of 125 ksi (Referencing the applicable table). Hence, the joint’s ultimate bearing strength is 985x(0.138/0.156)x(125/100)= 1,089 lbf [MMPDS-15-Table 8.1.5.1].
Since the Ultimate Shear Strength is smaller than the Joint Bearing Strength, the former will be considered as the joint allowable.
Screw’s Tensile Strength:
Ultimate Tensile Strength of the screw is ftu=545 lbf [Technical Data Sheet-MS24693].
The #8-32 MS24693-S50 Screw utilised to mount the Trackball pass through
The trackball Panel Mount Flange
0.0625” thick AL 2024-T3 ALCAD Sheet (Keyboard Tray).
Screw’s Shank Shear Strength:
the Ultimate Single Shear Strength of the screw is fsu=739x(33/35)=696 lbf [MMPDS-15-Table 8.1.5(a)]
Joint Bearing strength:
The thinnest sheet in this joint is AL 2024-T3 ALCLAD that has an ultimate bearing strength of 125 ksi (Referencing the applicable table). Hence, the joint’s ultimate bearing strength is 1,033x(125/100)= 1,291 lbf [MMPDS-15-Table 8.1.5.1].
Since the Ultimate Shear Strength is smaller than the Joint Bearing Strength, the former will be considered as the joint allowable.
Screw’s Tensile Strength:
Ultimate Tensile Strength of the screw is ftu=840 lbf [Technical Data Sheet-MS24693].
NAS1832 and NAS1834 Inserts
NAS1832 and NAS1834 Inserts’ list of properties [Technical Data Sheet-NAS1832, MMPDS-15-Table 8.1.1.2]
| P/N | Type | Size (Callout)(Thread)(Length) |
Material | Ds [in] |
(Fsu)(Ftu) for fastener material [ksi] |
Thread Standard |
|---|---|---|---|---|---|---|
| NAS1832-3-6 | Blind Threaded | (#10-32)(UNJF-3B)(0.75) | Cadmium Plated Carbon Steel | 0.19 | (0.6x85)(85) | AS8879 |
| NAS1832-3-4 | Blind Threaded | (#10-32)(UNJF-3B)(0.5) | Cadmium Plated Carbon Steel | 0.19 | (0.6x85)(85) | AS8879 |
| NAS1834-3-1000 | CSK Thru Clearance Hole | (-)(-)(1) | Cadmium Plated Carbon Steel | 0.19 | (0.6x85)(85) | - |
NAS1832-3-4&6
The NAS1832-3-4&6 Inserts are utilised to through 1” thick TEKLAM AA207-66-1000 (Honeycomb Panel Shelf). Due to the lack of available testing data for TEKLAM AA207-66-1000 [Technical Data Sheet-TEKLAM AA207-66-1000], the testing data for TEKLAM AA207-33-1000 [Technical Data Sheet-TEKLAM AA207-33-1000] will be used. This choice is still conservative since the TEKLAM AA207-66-1000 has higher core density and thicker foil gauge, compared with TEKLAM AA207-33-1000.
The NAS1832-3-7 (0.875” long) in TEKLAM AA207-33-1000 has a tensile and shear strength values of 1,122 lbf and 921 lbf, respectively [Technical Data Sheet-TEKLAM AA207-33-1000]. Since shorter inserts are weaker, these values will be scaled down as follows:
NAS1832-3-4: ftu= 1,122 x (0.5/ 0.875) = 641 lbf and fsu = 921 x (0.5/ 0.875) =526 lbf, respectively.
NAS1832-3-6: ftu= 1,122 x (0.75/ 0.875) = 961 lbf and fsu = 921 x (0.75/ 0.875) =789 lbf, respectively.
NAS1834-3-1000
The NAS1834-3-1000 Insert are utilised to through 1” thick TEKLAM AA207-66-1000 (Honeycomb Panel Shelf). Due to the lack of available testing data for TEKLAM AA207-66-1000 [Technical Data Sheet-TEKLAM AA207-66-1000], the testing data for TEKLAM AA207-33-1000 [Technical Data Sheet-TEKLAM AA207-33-1000] will be used. This choice is still conservative since the TEKLAM AA207-66-1000 has higher core density and thicker foil gauge, compared with TEKLAM AA207-33-1000.
The NAS1834-3-1000 in TEKLAM AA207-33-1000 has a tensile and shear strength values of 1,324 lbf and 1,026 lbf, respectively [Technical Data Sheet-TEKLAM AA207-33-1000].
FE200744 Stud
- 3/8-24 UNRF · zinc-plated carbon steel
- Ultimate shear: 2,000 lbf
- Ultimate tension: 5,000 lbf
- Track-tooth vertical allowable: 2,250 lbf per tooth
FE200744 Stud’s list of properties [Technical Data Sheet-FE200744, MMPDS-15, Table 9.7.1.1, Table 8.1.2(b), Table 8.1.5(a), Table 8.1.5(b1), Table 8.1.5(b2), Analysis and Design of Flight Vehicle Structures by Bruhn-Table D1.7.]
| P/N | Type | Size (Callout)(Thread)(Length) |
Material | Ds [in] |
(fsu)(ftu) for fastener in single shear [lbf] |
|---|---|---|---|---|---|
| FE200744 | Lower attachment Stud | (3/8-24)(UNRF)(0.9) | Zinc Plated Carbon steel | 0.375 | (2,000)(5,000) |
The FE200744 stud is utilized in a Seat Track Stud (P/N 002-2302515-1) that is made from 0.125” thick AL 2024-T351 Plate. Conservatively, the Bearing Strength of 0.25” thick AL 2024-T351 Plate will be considered. The bearing strength is Fbru=119 ksi [MMPDS-15-Table 3.2.4.0(b2)]. Therefore, the Unit Bearing Strength of the joint is fbru=4688*119/100 = 5,578 [MMPDS-15-Table 8.1.5.1].
Since the Ultimate Shear Strength is less than the ultimate bearing strength, the former will be the joint allowable.
Track tooth allowable:
Based on [Technical Data Sheet-ANCRA Aircraft Track], the Medium Duty Anodized Aircraft Track (P/N 40456-10-144) has a vertical load allowable of 4500 lbf. Hence, the vertical load allowable per tooth is 4500/2 = 2,250 lbf (this is the allowable reaction force exerted on the rail lip by the FE200744 lock head).
Upper Attachment Stud
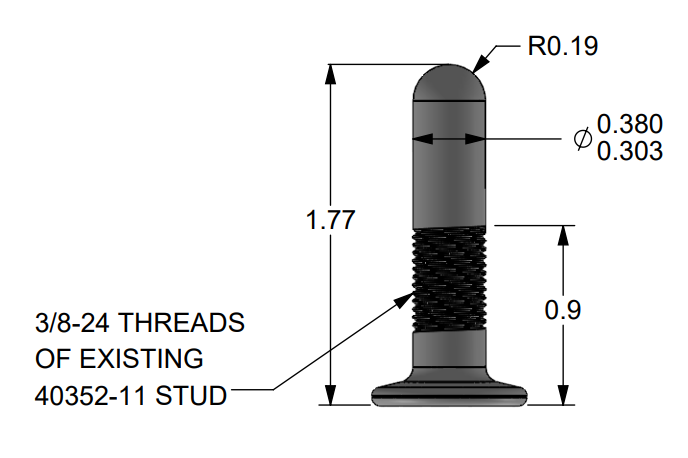
The custom stud has no direct published capacity. The available ANCRA threaded-stud specification is used as the strength basis, followed by a separate local bending check of the reduced section and a seat-track tooth check.
The customized Upper Attachment Stud is made from the ANCRA Threaded Stud. However, its load capacity is not available. Hence, ANCRA Threaded Stud (P/N 40351-10) [40351 and 40352 Threaded Stud-Specs] will be used to determine the Upper Attachment Stud allowable.
As shown in [40351 and 40352 Threaded Stud-Specs], the load capacity for ANCRA Threaded Stud (P/N 40351-10) is 4000 lbf in any direction. Moreover, both ANCRA Threaded Studs (P/N 40352-10 & 40351-10) are made from the same material. However, only P/N 40352-10 is heat treated to 180-200 ksi per AMS-H-6875 and is made per MIL-S-6049 that has ultimate tensile strength of 125ksi.
Stud Bending:
At the head of the fastener there is region that increases in diameter, and its length is approximately 0.18”. Moreover, there is a curved portion at the tip of the stud that can be discounted since the worst (and still conservative) case would be a concentrated load at the beginning of the full diameter. Consequently, the bending arm can be calculated as follows:
Hence, the maximum allowable shear load before bending failure
occurs, can be calculated as follows:
Track tooth allowable:
Based on [Ancra Clear Medium-Duty Aircraft Track-Anodized - 40456-10-144-Specs], the seat track’s vertical load allowable is 4500 lbf. Hence, the vertical load allowable per tooth is 4500/2 = 2,250 lbf (this is the allowable reaction force exerted on the rail lip by the stud fastener head)
Load Cases Formulation
Flight-load framework
FAR 25.321 and 25.331–25.351
- General flight loads and symmetric maneuver response
- Flight maneuver envelope and design airspeeds
- Limit maneuver factors, gust and turbulence loads
- Fuel/oil, high-lift, rolling and yaw conditions
Emergency landing
FAR 25.561
- Forward: 9 g
- Downward: 6 g
- Upward: 3 g
- Sideward: 3 g airframe / 4 g seats & attachments
- Rearward: 1.5 g
Vertical flight-load extraction. The workstation spans X274.4–X299.4. X287.99 is used conservatively to extract the vertical acceleration from the DHC-8-100 fuselage-station load charts.
Vertical limit load values () at X287.99 for the Upward and Downward load directions.
Load Direction |
X287.99 [g] |
|---|---|
| Upward | 2.84 |
| Downward | 4.53 |
These are the limit loads values. However, the ultimate load values must be used for the static stress analysis purposes. The ultimate load values () can be obtained by multiplying the limit load values by 1.5. The table below lists these values.
Vertical ultimate load values () at X287.99 for the Upward and Downward load directions.
Load Direction |
X287.99 [g] |
|---|---|
| Upward | 4.26 |
| Downward | 6.80 |
Hence, the load cases that the Starboard Workstation will be checked against are listed in the applicable table.
Load Cases
Load Case Number |
Load Factor Direction |
Ultimate Load Value () [g] |
Governing basis |
|---|---|---|---|
| 1 | Up | 4.26 | Flight |
| 2 | Down | 6.8 | Flight |
| 3 | Outboard | 3.0 | Emergency landing |
| 4 | Inboard | 3.0 | Emergency landing |
| 5 | Forward | 9.0 | Emergency landing |
| Not required* | Aft | 1.5 | Covered conservatively by Forward case |
| * The Aft case is covered conservatively by the 9g Forward case and is not analyzed separately. | |||
I screened the workstation against the applicable flight and emergency-landing accelerations and retained the governing demand for each direction. The vertical flight cases govern Upward and Downward at 4.26g and 6.80g, while the emergency-landing criteria govern Outboard, Inboard, and Forward at 3g, 3g, and 9g. The 1.5g Aft condition is enveloped by the Forward case, so five distinct ultimate-load cases are sufficient without duplicating a weaker reverse-direction case.
Finite Element Analysis (FEA)
The Port and Starboard Workstations are installed in the DHC-8-100 aircraft opposite to each other. Both workstations’ layouts are identical and positioned at X274.4 and extends till X299.4. Hence, both workstations experience the same vertical ultimate load. Moreover, the starboard workstation carries more equipment compared to the port workstation, so it is heavier. Therefore, the structural substantiation of the Port Workstation is effectively covered by the analysis of the Starboard Workstation, and only the only the Starboard Workstation (No. 2) will be modeled and analyzed, and the other workstation will be assessed by comparison.
Model
Beam elements · tube & braces
Slender members carry load primarily through axial force, shear and bending. Beam idealization preserves section properties and member force recovery with far lower model cost than solid geometry.
Plate elements · sheet structure
Thin panels and brackets are represented by midsurface plates so membrane and bending stresses are recovered directly through the sheet thickness definition.
CBUSH · discrete fasteners
Node-to-node connector elements preserve a discrete load path and enable direct reaction extraction without rigidly tying the joint rotational behavior.
RBE3 · equipment masses
RBE3 distributes inertia load into surrounding structural nodes without adding artificial stiffness to the supporting panels or tube structure.
NSM · omitted nonstructural content
Panels, hardware and small non-load-bearing items are omitted geometrically but retained as distributed nonstructural mass, preserving inertia while avoiding unnecessary mesh/detail.
Non-penetrating interface
The attachment gusset / upper support angle interface transfers compressive contact load without creating an artificial tensile tie across the mating surfaces.
Upper brace omitted
Removing the brace eliminates a potential parallel load path; the remaining modeled structure therefore carries the reaction without credit for that support contribution.
Noncritical holes covered
Suppressing holes that do not define the primary load path avoids local numerical peaks and reduces mesh density while retaining structural stiffness at the substantiation scale.
The Top Table and Mission Computer are combined into one equivalent lumped mass using a weight-averaged CoG:
Loads and Constraints
Upper attachments: lateral and longitudinal translation restrained; vertical translation remains free.
The constraint set follows the attachment kinematics while avoiding unnecessary upper vertical fixity that would create an artificial load path and over-stiffen the workstation.
Analysis
SESTATIC · SOL 101
Linear static analysis is appropriate for the ultimate inertia load cases used for strength substantiation.
Mass is entered in lbm, density in lbm/in³ and acceleration in in/s². WTMASS provides consistent mass-to-force conversion so solver forces are recovered in lbf and stresses in psi.
FEA Results
Tube Structure
Weld assessment geometry. The weld is idealized with 1/16 in external reinforcement and 1/32 in penetration. Tube and weld section properties are evaluated separately so the recovered member forces can be converted to local weld stresses without assuming the base-tube section remains unchanged.
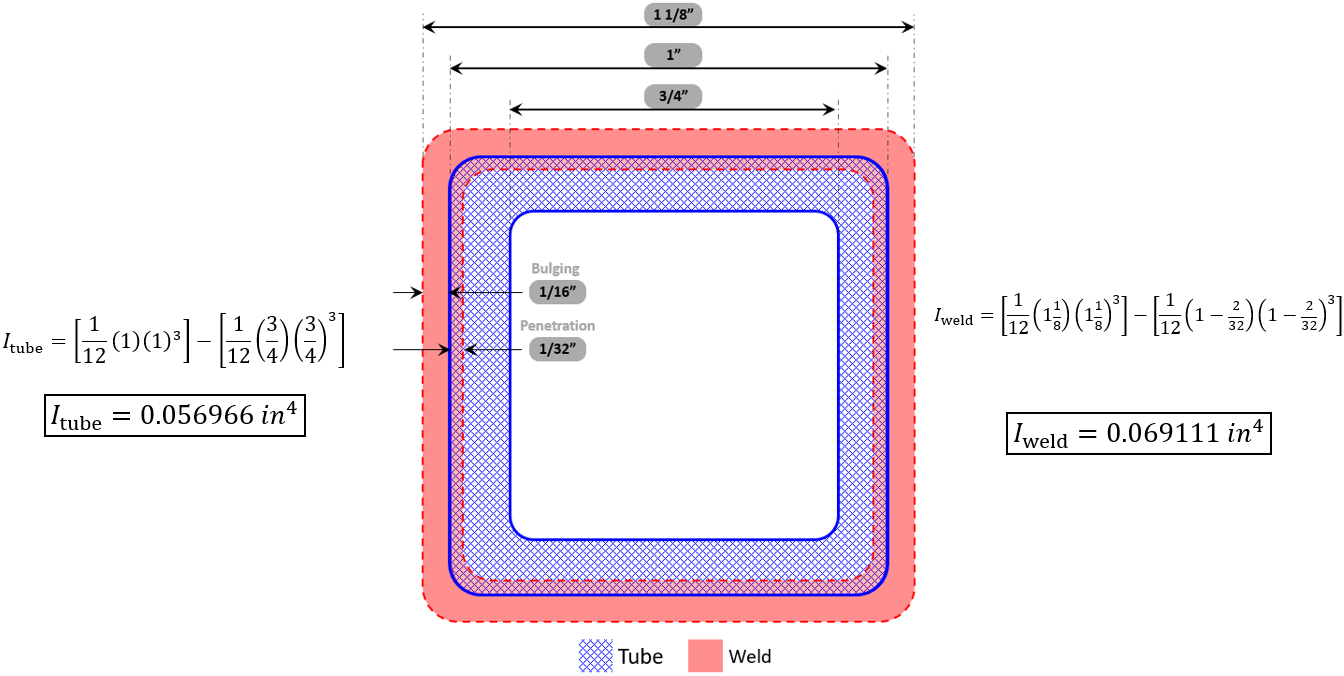
For a given bending moment (), the ratio of weld bending stress () to the tube bending stress () can be calculated as follows:
Hence, the weld bending stress () can be expressed as follows:
For a given axial load (), the ratio of weld axial stress () to the tube axial stress () can be calculated as follows:
Hence, the weld axial stress () can be expressed as follows:
The maximum Axial Force and Bending moments within the tube structure occur at different locations. Therefore, the tensile and compressive combined stresses (due to axial and bending moments loads) were calculated for each element within the tube structure using excel sheet.
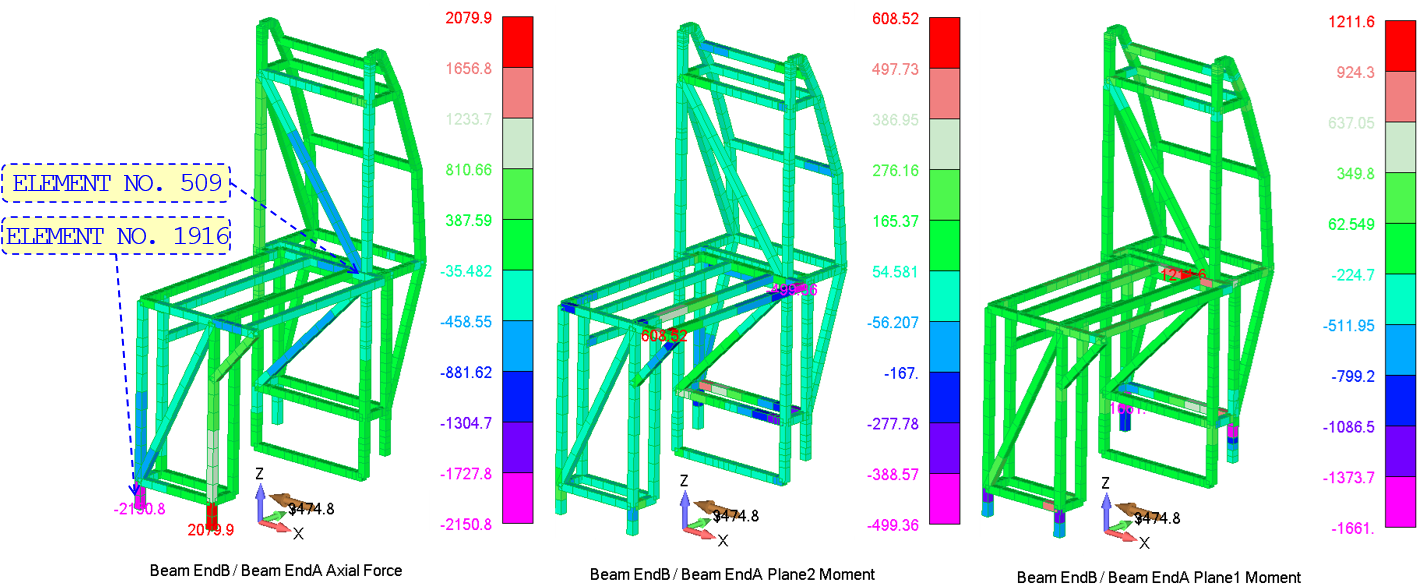
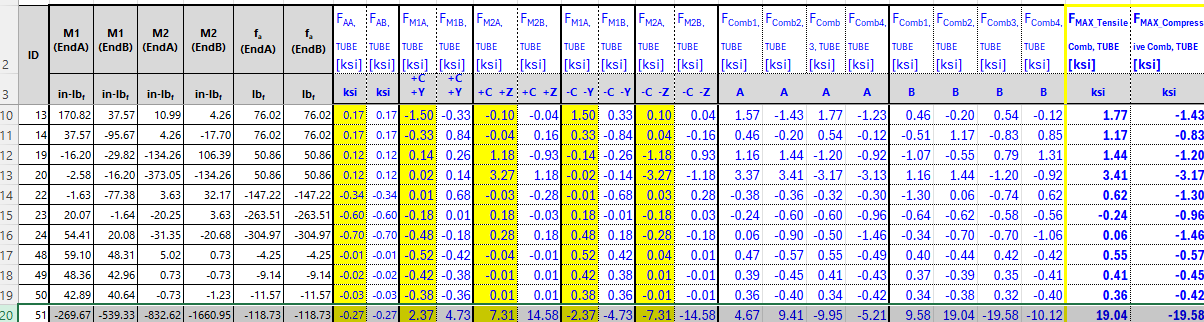
The Axial Force and Bending Moments at Elements 51 and 1916 for the Forward Lode Case.
| ID | M1 (EndA) |
M1 (EndB) |
M2 (EndA) |
M2 (EndB) |
fa (EndA) |
fa (EndB) |
|---|---|---|---|---|---|---|
| [in-lbf] | [in-lbf] | [in-lbf] | [in-lbf] | [lbf] | [lbf] | |
| 51 | -269.67 | -539.33 | -832.62 | -1660.95 | -118.73 | -118.73 |
| 1916 | 235.48 | 470.96 | -661.48 | -1321.29 | -2150.84 | -2150.84 |
The maximum tensile and compressive combined stresses occur at elements No. 51 and No 1916, respectively, and they belong to the forward load case. Considering the values in the applicable table, the stress calculations at Element No. 51 is as follows:
The axial and bending stresses at the tubes:
Therefore, the maximum axial and bending stresses at the welds can be estimated as below:
Hence, the maximum tensile and compression combined stresses on the tubes can be calculated as below (the bold values are the maximums):
Hence, the maximum tensile and compression combined stresses on the welds can be calculated as below (the bold values are the maximums):
The Maximum Tensile and Compressive Combined Stresses in the Tube and at The Weld for All Load Cases
| FWD | INBOARD | OUTBOARD | UPWARD | DOWNWARD | ||||||
|---|---|---|---|---|---|---|---|---|---|---|
| Tube | Weld | Tube | Weld | Tube | Weld | Tube | Weld | Tube | Weld | |
| FTensile Comb [ksi] | 19.04 | 17.60 | 4.39 | 4.10 | 5.36 | 5.08 | 2.40 | 2.24 | 3.67 | 3.41 |
| FCompressive Comb [ksi] | -20.65 | -20.15 | -5.36 | -5.08 | -4.39 | -4.10 | -2.30 | -2.14 | -3.85 | -3.59 |
Maximum Axial, Bending, and Combined Stresses for Elements No. 51 and 1916 for the Forward Load Case
| Description | Stresses on Tubes | Element No. | Stress on Welds | Element No. | ||
|---|---|---|---|---|---|---|
| 51 | 1916 | 51 | 1916 | |||
| Axial Stress | -0.27 | -4.92 | -0.31 | -5.56 | ||
| -0.27 | -4.92 | -0.31 | -5.56 | |||
| Maximum Bending Stress due to M1 | ± 2.37 | ± 2.07 | ± 2.20 | ± 1.92 | ||
| ± 4.73 | ± 4.13 | ± 4.39 | ± 3.83 | |||
| Maximum Bending Stress due to M2 | ± 7.31 | ± 5.81 | ± 6.78 | ± 5.39 | ||
| ± 14.58 | ± 11.6 | ± 13.52 | ± 10.75 | |||
| Maximum Bending Stress due to M1 and M2 | ± 9.68 | ± 7.88 | ± 8.98 | ± 7.3 | ||
| ± 19.31 | ± 15.73 | ± 17.91 | ± 14.58 | |||
| Maximum Tensile Combined Stress | 9.41 | 2.96 | 8.67 | 1.74 | ||
| 19.04 | 10.81 | 17.60 | 9.02 | |||
| Maximum Compressive Combined Stress | -9.95 | -12.80 | -9.29 | -12.9 | ||
| -19.58 | -20.65 | -18.20 | -20.1 | |||
The tube structure is fabricated from 1”x1”x0.125” AL 6061-T6 extrusion. This material selection is noted for its high Ultimate Tensile Stress value of (Referencing the applicable table), and its Compression Yield Stress value is . Adjacent to the weld areas, Ultimate Tensile Stress and the Compression Yield Stress values are and , respectively [Aluminum Design Manual 2010-Table 2-19W]. This reduction in strength accounts for the weakening effects of welding, which includes alterations in microstructure and potential introduction of stress concentrators. Therefore, the margin of safety in the Tube Structure can be computed as below:
Since the stress levels exceed the proportional limit (plastic range), the values resulted from the classic bending hand analysis (linear finite analysis) will be conservative and unrealistic. In this situation, plastic bending methods should be considered.
In this report, Cozzone method is used. This method implies that the bending moment of the true stress distribution about the neutral axis is greater than that of a linear distribution. Hence, a trapezoidal stress distribution is used to approximate the true stress distribution. It is assumed that the outer fiber does not reach ultimate strength (maximum stress ) until the material closer to the neutral axis sees an increased level of stress ().
is a fictional stress which is assumed to exist at the neutral axis (at zero strain). The value of is expressed as below [Analysis & Design of Composite & Metallic Flight Vehicle Structures by Richard Abbott-Plastic Bending]:
Where is the maximum allowable stress, is the maximum strain at , is the plastic strain, and is Ramberg-Osgood number. Based on the applicable data, AL 6061-T6 extrusion has an Ultimate Tensile Stress value of , Yield Tensile Stress Value of , Modulus of Elasticity value of , and maximum strain equals .
Setting equals to the Ultimate Tensile Stress (), the plastic strain and Ramberg-Osgood number can be calculated as follows:
Then, the value of can be computed as below:
In order to calculate the ultimate bending strength, the shape factor () must be computed for the tube’s cross section. This factor depends on the geometry of the cross section, and it equals to the ratio of the plastic section modulus (Z) to the elastic section modulus (S). This can be expressed as below [Roark’s Formulas for Stress and Strain (9th Ed)-Page 829]:
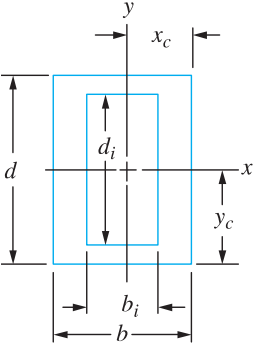
Therefore, the Bending Modulus of Rupture for the tubes can be calculated as below [Analysis & Design of Flight Vehicle Structures by Bruhn-Page C3.3]:
This value is scaled down by a factor of to take into consideration the weld effect. Hence, the scaled Bending Modulus of Rupture . Therefore, the axial and bending stress ratios can be expressed as below:
Therefore, the margin of safety can be calculated as below:
Column-Buckling allowable:
The column buckling allowable can be expressed as below:
Where, K is the buckling coefficient. Ec is the compressive modulus of elasticity of the material. I is the minimum moment of inertia of the column. L is the total length of column.
Since the tubes are welded and we are considering bending at the welds they are closer to fixed supports. A reasonable approximation would be to calculate the column allowable for the fixed-fixed case (K=4) as well as the pinned-pinned (K=1) case, then the average of the resulted critical values will be our benchmark.
The most critical beam in the tube structure has a length of 25.5 in. Therefore, the critical buckling stresses can be calculated as below:
As previously shown, the maximum compressive combined stress is and it occurs at the tubes, Therefore, the margin of safety in the Welded Tube Structure can be computed as below:
Note: The longest beam in the tube structure has a length of 57 in. However, it is welded at multiple locations along the beam (n>1). Therefore, it will result in a higher critical buckling stress value.
Cross Braces
the corresponding figure, provides a cross-sectional view of the Cross Braces Beams as modeled. the applicable table summaries its specifications extracted from FEMAP.
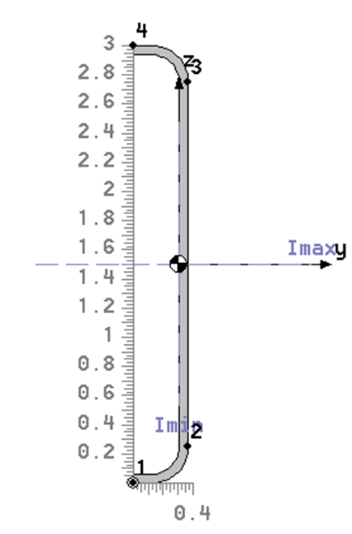
Cross Braces Beams’ Specifications
| Parameter | Direction | Symbol | Value | Unit |
|---|---|---|---|---|
| Area | - | A | 0.214829 | in2 |
| Distance from the neutral axis to the outermost surface | +y-axis | cY,+ | 0.06742 | in |
| -y-axis | cY,- | -0.30758 | in | |
| +z-axis | cZ,+ | 1.5 | in | |
| -z-axis | cZ,- | -1.5 | in | |
| Second moment of inertia | z-axis | Izz | 0.00149557 | in4 |
| y-axis | Iyy | 0.198307 | in4 | |
| Centroid From Origin | Y | COGY | 0.30758 | in |
| Z | COGZ | 1.5 | in |
The maximum Axial Force and Bending moments within the Cross Braces Beams occur at different locations. Therefore, the tensile and compressive combined stresses (due to axial and bending moments loads) were calculated for each element within the Cross Braces Beams.
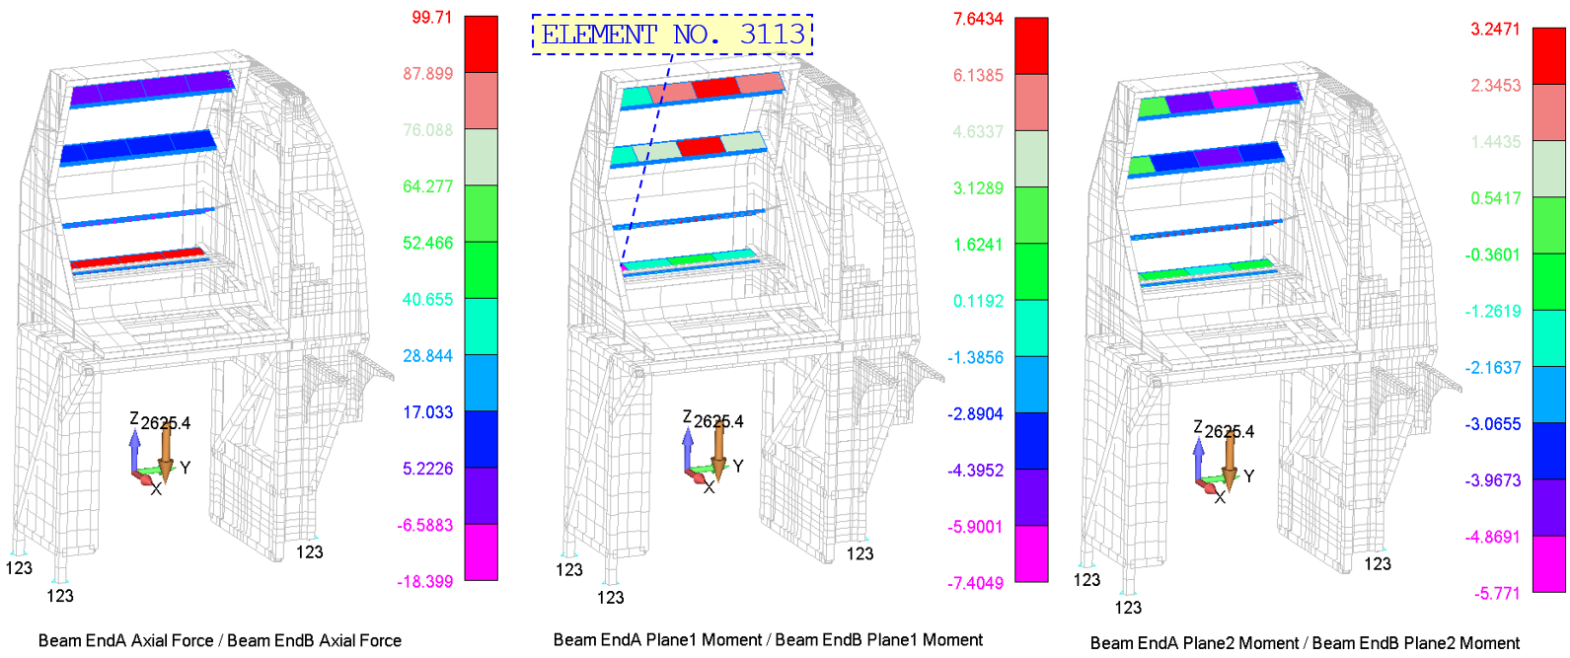
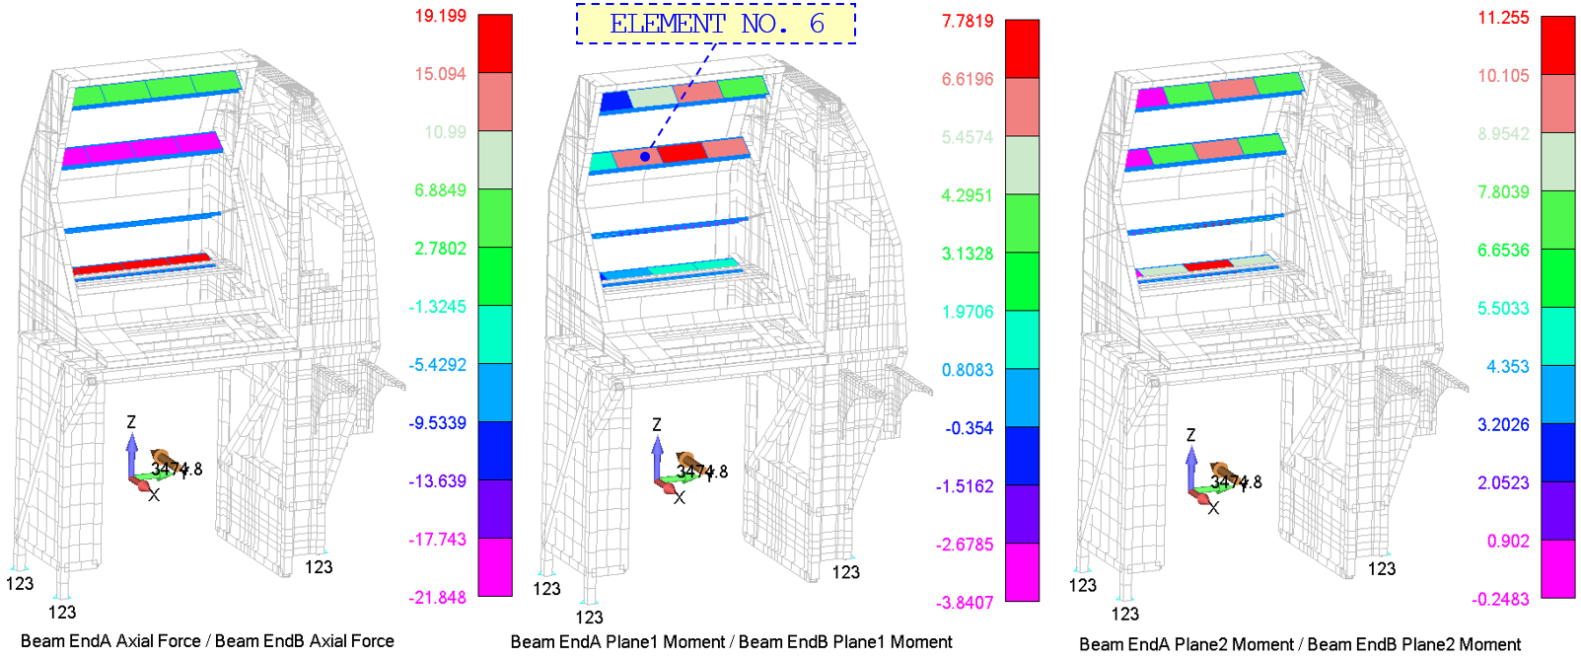
The Axial Force and Bending Moments at Elements 6 and 3113.
| ID | M1 (EndA) |
M1 (EndB) |
M2 (EndA) |
M2 (EndB) |
fa (EndA) |
fa (EndB) |
Load Case |
|---|---|---|---|---|---|---|---|
| [in-lbf] | [in-lbf] | [in-lbf] | [in-lbf] | [lbf] | [lbf] | ||
| 6 | 6.26 | 7.78 | 6.88 | 9.62 | -21.85 | -21.85 | Forward |
| 3113 | -7.40 | -1.18 | -0.11 | -1.19 | 99.71 | 99.71 | Downward |
The maximum tensile and compressive combined stresses occur at elements No. 6 and No. 3113, respectively, and they belong to the forward and downward load cases, respectively. the applicable table summaries the maximum tensile and compressive combined stresses across the Cross Braces Beams for all load cases.
The Maximum Tensile and Compressive Combined Stresses across the Cross Braces Beams for All Load Cases
| FWD | INBOARD | OUTBOARD | UPWARD | DOWNWARD | |
|---|---|---|---|---|---|
| [ksi] | 1.57 | 0.74 | 0.71 | 0.66 | 1.51 |
| [ksi] | -0.90 | -0.71 | -0.74 | -0.95 | -1.06 |
The Cross Braces Beams are fabricated from 0.0625” thick AL 2024-T3 ALCLAD Sheet. This material selection is noted for its high Ultimate Tensile Stress value of (Referencing the applicable table), and its Compression Yield Stress value is . Therefore, the Cross Braces Beams pass by observation.
Shelf Braces
The figure below provides a cross-sectional view of the Shelf Braces Beams. the applicable table summaries its specifications extracted from FEMAP.
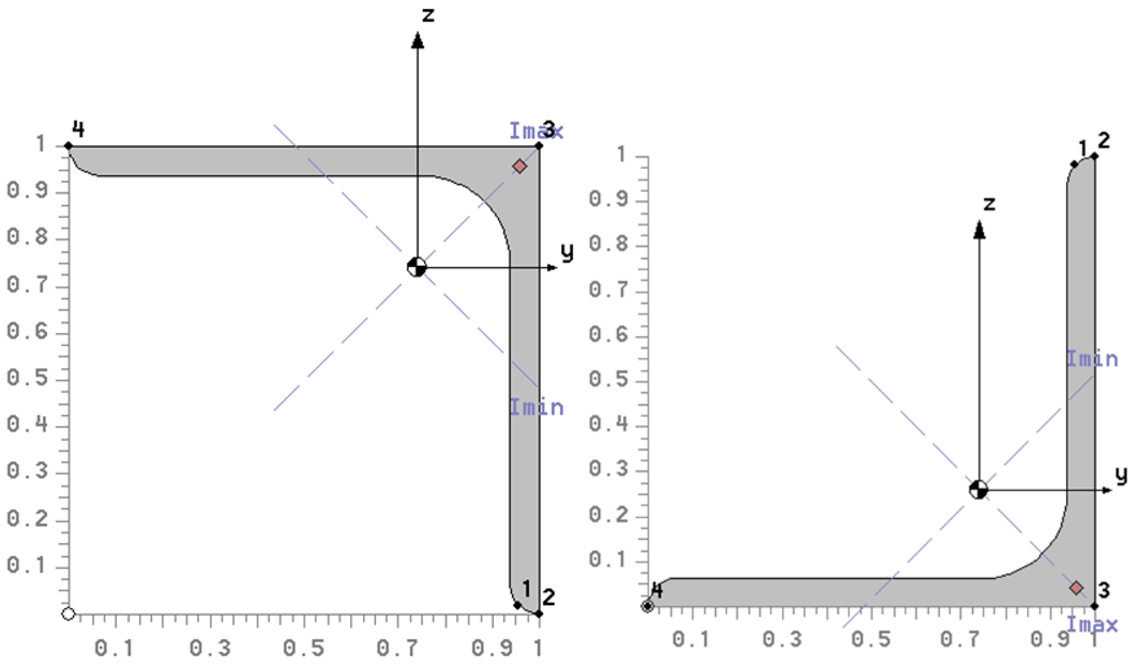
Shelf Braces Beams’ Specifications
| Parameter | Direction | Symbol | Aft Shelf Brace | Fwd Shelf Brace | Unit |
|---|---|---|---|---|---|
| Area | - | A | 0.12789 | 0.128 | in2 |
| Distance from the neutral axis to the outermost surface | +y-axis | cY,+ | 0.260 | 0.260 | in |
| -y-axis | cY,- | -0.740 | -0.740 | in | |
| +z-axis | cZ,+ | 0.260 | 0.740 | in | |
| -z-axis | cZ,- | -0.740 | -0.260 | in | |
| Second moment of inertia | z-axis | Izz | 0.0116741 | 0.0116741 | in4 |
| y-axis | Iyy | 0.0116741 | 0.0116741 | in4 | |
| zy-axis | Izy | -0.0066726 | 0.0066726 | in4 | |
| Centroid From Origin | Y | COGY | 0.73996 | 0.73996 | in |
| Z | COGZ | 0.73996 | 0.260038 | in |
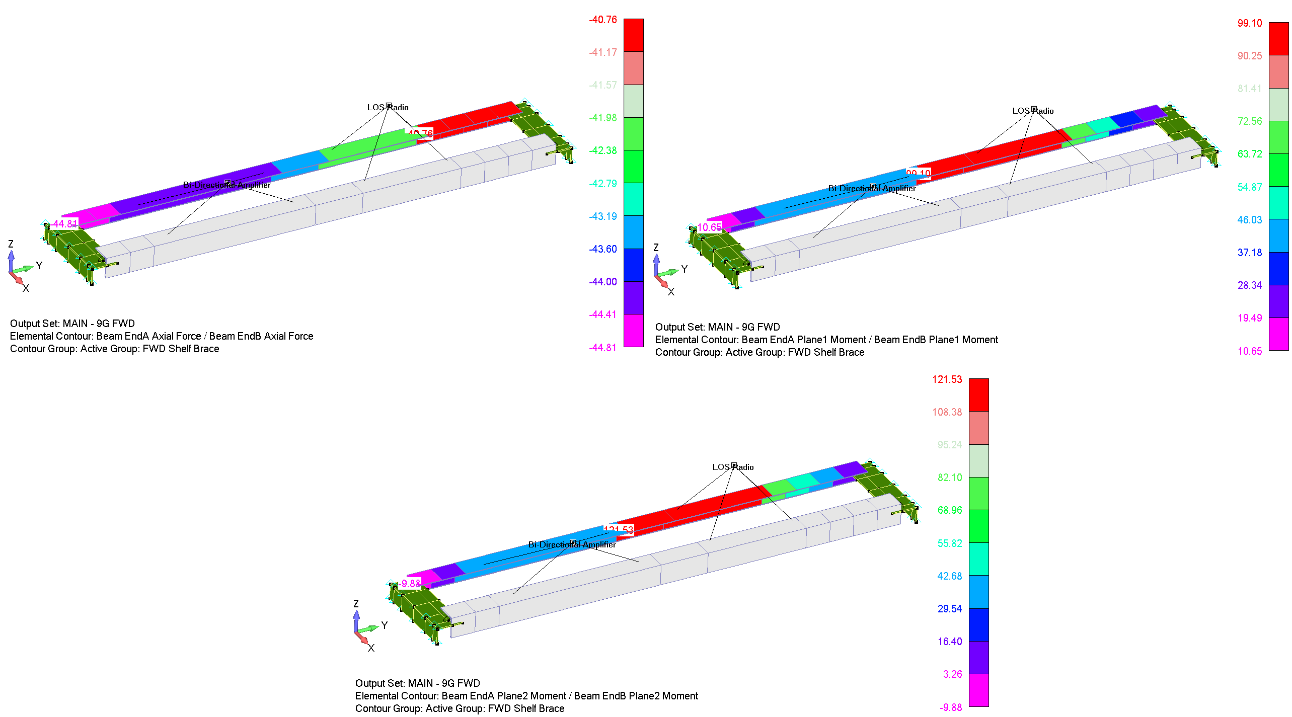
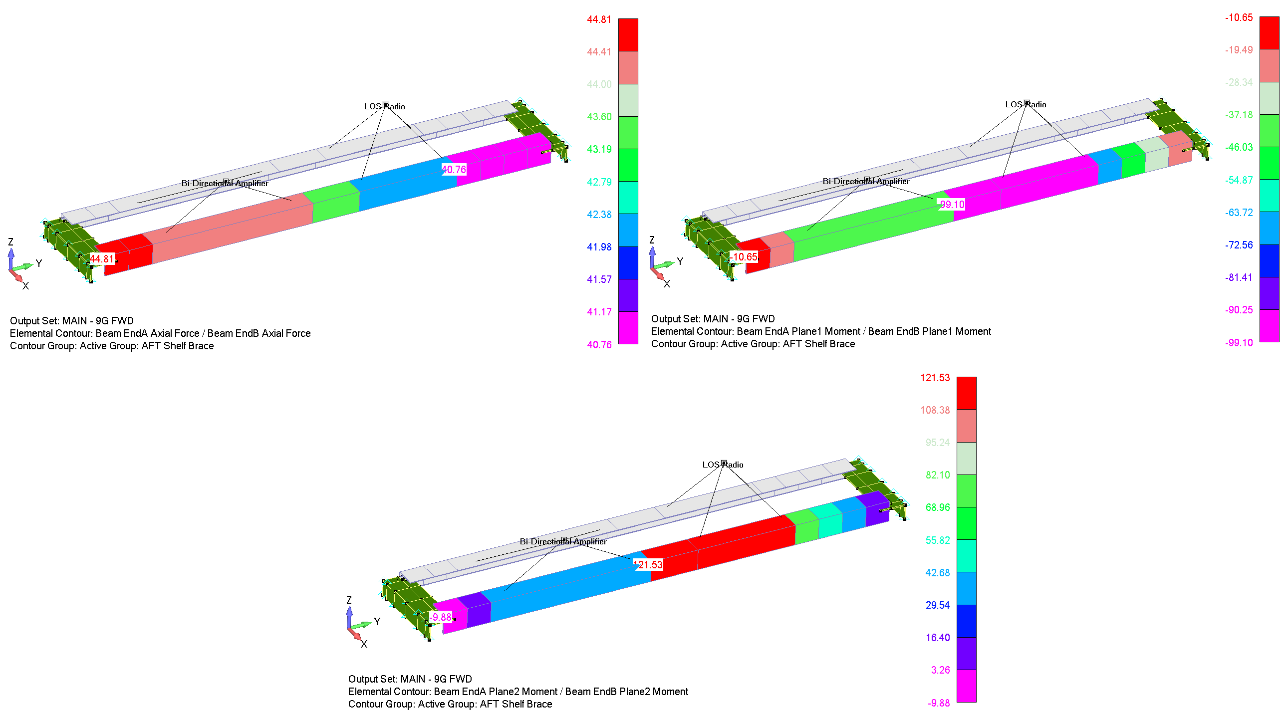
The Axial Force and Bending Moments at selected Elements from both beams.
| ID | M1 (EndA) |
M1 (EndB) |
M2 (EndA) |
M2 (EndB) |
fa (EndA) |
fa (EndB) |
Load Case | Beam |
|---|---|---|---|---|---|---|---|---|
| [in-lbf] | [in-lbf] | [in-lbf] | [in-lbf] | [lbf] | [lbf] | |||
| 178 | 44.79 | 99.26 | 39.46 | 121.36 | -44.05 | -44.05 | Forward | FWD Shelf Brace |
| 179 | 99.10 | 97.02 | 121.53 | 112.58 | -43.28 | -43.28 | Forward | FWD Shelf Brace |
| 121 | 21.8 | 53.9 | -11.6 | -11.6 | 53.2 | 53.2 | Forward | AFT Shelf Brace |
| 122 | -99.10 | -97.02 | 121.53 | 112.58 | 43.28 | 43.28 | Forward | AFT Shelf Brace |
The maximum tensile and compressive combined stresses, in the FWD Shelf Brace, occur at elements No. 178 and No. 179, respectively, and they belong to the forward load case. In addition, the maximum tensile and compressive combined stresses, in the AFT Shelf Brace, occur at elements No. 121 and No. 122, respectively, and they belong to the forward load case. Considering the values in the applicable table, the stress calculations at both ends of Element No. 178 are as follows:
At END A
The axial and bending stresses:
Hence, the tensile and compression combined stresses can be calculated as below (the bold value is the maximum):
At END B
The axial and bending stresses:
Hence, the tensile and compression combined stresses can be calculated as below (the bold value is the maximum):
Doing the same for each element, the tensile and compression combined stresses can be obtained, and the maximum values can be determined. The table below summarizes the maximum tensile and compressive combined stresses across both the FWD and AFT Shelf Braces Beams for all load cases.
The Maximum Tensile and Compressive Combined Stresses across the FWD Shelf Brace Beam for All Load Cases
| FWD | INBOARD | OUTBOARD | UPWARD | DOWNWARD | ||
|---|---|---|---|---|---|---|
| [ksi] | 21.42 | 0.44 | 0.43 | 8.00 | 17.29 | FWD Shelf Brace |
| [ksi] | -22.69 | -0.43 | -0.44 | -10.83 | -12.77 | FWD Shelf Brace |
| 22.69 | 0.44 | 0.33 | 3.49 | 2.12 | AFT Shelf Brace | |
| -21.42 | -0.33 | -0.44 | -1.33 | -5.58 | AFT Shelf Brace |
The Shelf Braces Beams are fabricated from 0.063” thick AL 6061-T6 Extrusion. This material selection is noted for its high Ultimate Tensile Stress value of (Referencing the applicable table), and its Compression Yield Stress value is . Therefore, the margin of safety for the Shelf Braces Beams can be computed as below:
Flange Crippling
Crippling is a mode of failure that occurs due to compression effects. Typically, this is a check that is applied to thin-walled columns where the local stability of the cross section may not allow the column to achieves its full column strength.
The basic crippling stress equation is given by:
Where
t: Angle thickness, in
b: Minimum leg length, in
h: Maximum leg length, in
Fcy: Material compressive yield Strength, psi
E: Material young’s modulus, psi
Therefore, the crippling stress for the shelf brace beam’s cross-section can be calculated as below:
Therefore, the margin of safety for the Shelf Braces Beams against crippling can be computed as below:
Structural Sheet Metals and their Attachments
In this section, the structural sheet metals will be assessed based on the maximum tensile and compressive principal stresses. The maximum tensile principal stress will be checked against the allowable ultimate tensile strength (Ftu) of the material. On the other hand, the maximum compressive principal stress will be checked against the allowable yield compressive strength (Fcy) of the material. The maximum principal stress (F1) and the minimum principal stress (F2) on both sides of the plates were reviewed for all cases, and it is summarized in the applicable table.
Maximum and Minimum Principal Stresses for the Structural Sheet Metals within the Starboard Workstation. The highlighted cells represent the maximum tensile and compressive principal stresses.
| 2024-T3 ALCAD Sheet | FWD | UP | DOWN | IN | OUT | MAX Tension [ksi] |
MAX Compression [ksi] |
||||||
|---|---|---|---|---|---|---|---|---|---|---|---|---|---|
| F1 [ksi] |
F2 [ksi] |
F1 [ksi] |
F2 [ksi] |
F1 [ksi] |
F2 [ksi] |
F1 [ksi] |
F2 [ksi] |
F1 [ksi] |
F2 [ksi] |
||||
| Top | Tension | 75.27 | 63.59 | 26.91 | 5.83 | 83.90 | 15.34 | 77.70 | 30.33 | 90.81 | 45.97 | 100.54 | 100.54 |
| Compression | 17.43 | 70.00 | 9.61 | 52.56 | 9.31 | 42.95 | 45.97 | 90.81 | 30.33 | 77.70 | |||
| Bot | Tension | 69.98 | 17.28 | 52.64 | 9 | 43.24 | 8.35 | 100.54 | 44.16 | 87.59 | 28.06 | ||
| Compression | 63.79 | 75.36 | 5.23 | 27.09 | 14.37 | 84.02 | 28.06 | 87.59 | 44.16 | 100.54 | |||
| 2024-T351 Plate | FWD | UP | DOWN | IN | OUT | MAX Tension [ksi] |
MAX Compression [ksi] |
||||||
| F1 [ksi] |
F2 [ksi] |
F1 [ksi] |
F2 [ksi] |
F1 [ksi] |
F2 [ksi] |
F1 [ksi] |
F2 [ksi] |
F1 [ksi] |
F2 [ksi] |
||||
| Top | Tension | 51.27 | 25.61 | 7.13 | 2.69 | 28.06 | 9.89 | 19.39 | 13.22 | 23.61 | 7.90 | 51.27 | 48.50 |
| Compression | 9.47 | 15.10 | 6.19 | 17.58 | 4.29 | 11.38 | 7.90 | 23.61 | 13.22 | 19.39 | |||
| Bot | Tension | 19.32 | 5.89 | 17.39 | 8.02 | 10.46 | 4.64 | 23.68 | 7.92 | 19.74 | 8.33 | ||
| Compression | 19.26 | 48.5 | 2.9 | 6.55 | 12.8 | 27.77 | 8.33 | 19.74 | 7.92 | 23.68 | |||
| 6061-T6&T6511 EXT | FWD | UP | DOWN | IN | OUT | MAX Tension [ksi] |
MAX Compression [ksi] |
||||||
| F1 [ksi] |
F2 [ksi] |
F1 [ksi] |
F2 [ksi] |
F1 [ksi] |
F2 [ksi] |
F1 [ksi] |
F2 [ksi] |
F1 [ksi] |
F2 [ksi] |
||||
| Top | Tension | 22.87 | 10.32 | 3.24 | 1.47 | 7.50 | 1.89 | 12.09 | 4.22 | 16.32 | 4.03 | 40.58 | 35.99 |
| Compression | 8.47 | 35.99 | 1.18 | 4.70 | 2.35 | 5.17 | 4.03 | 16.32 | 4.22 | 12.09 | |||
| Bot | Tension | 40.58 | 13.75 | 5.74 | 1.93 | 4.92 | 1.73 | 19.34 | 6.15 | 11.88 | 3.68 | ||
| Compression | 8.03 | 24.35 | 1.08 | 3.08 | 3.08 | 9.16 | 3.68 | 11.88 | 6.15 | 19.34 | |||
The highlighted cells represent the maximum tensile and compressive principal stresses. Upon reviewing the Finite Element Model (FEM), these stresses are associated with localized critical locations exhibiting peak values. Such stresses are typically irregular and are often excluded from overall failure assessments, as they do not represent the overall stress distribution across the structure. These irregularities are commonly attributed to mesh singularities, geometric discontinuities, or sharp stress gradients, necessitating careful evaluation.
In the subsequent subsections, elements corresponding to these localized peak stresses will be excluded from the failure assessment. To achieve this, threshold stress values for both tensile and compressive stresses will be defined. Elements with principal stress values exceeding the tensile threshold or falling below the compressive threshold will be flagged for further review. If their locations correspond to non-representative regions within the FEM, these elements will be omitted from the failure assessment to ensure a focus on realistic stress behavior.
Following the exclusion of these elements, a new maximum and minimum principal stresses for the structural sheet metal will be determined. These stresses will then be compared against the corresponding material allowable limits: the ultimate tensile strength (Ftu) for the maximum tensile principal stress and the compressive yield strength (Fcy) for the maximum compressive principal stress.
It is noteworthy that some of the remaining elements, despite falling within the threshold limits, may still reside in critical regions of the structure. However, they will be included in the failure assessment as part of a conservative methodology, ensuring a thorough and realistic evaluation of the structure's integrity while accounting for safety margins. This approach minimizes the influence of numerical artifacts and enhances the reliability of the analysis.
Purpose: prevent mesh singularities, geometric discontinuities, and other non-representative local peaks from governing the global sheet-metal strength assessment without engineering review.
- Screen the global maximum and minimum principal stresses for every load case.
- Apply the source-defined tensile and compressive thresholds; the 2024-T3 ALCAD and 2024-T351 assessments use ±30 ksi screening limits.
- Flag elements outside the thresholds and inspect their physical FEM locations.
- Exclude only confirmed non-representative localized peaks from the failure assessment.
- Recalculate the governing principal stresses using the remaining elements and compare them with Ftu and Fcy.
- Retain critical elements that remain within the screening threshold as part of the conservative assessment.
This keeps numerical artifacts from controlling the reported margin while preserving conservative coverage of physically representative high-stress regions.
2024-T3 ALCAD Sheet
In the 2024-T3 ALCAD Sheets, a tensile and compressive threshold values are set to 30 ksi and -30 ksi, respectively. The table below lists the flagged elements that have principal stress values falling out of the set thresholds. The figure below shows the elements locations within the structure in the FEM.
The Flagged Elements within the 2024-T3 ALCAD Sheets that have Principal Stress Values Falling Out of the Set Thresholds
| ID | FWD | UP | DOWN | IN | OUT | |||||||||||||||
|---|---|---|---|---|---|---|---|---|---|---|---|---|---|---|---|---|---|---|---|---|
| F1 | F2 | F1 | F2 | F1 | F2 | F1 | F2 | F1 | F2 | |||||||||||
| T | B | T | B | T | B | T | B | T | B | T | B | T | B | T | B | T | B | T | B | |
| 3036 | 20.4 | 10.1 | -10.2 | -19.8 | -0.5 | 19.1 | -19.6 | 0.2 | 31.3 | -0.3 | 0.8 | -30.5 | 1.8 | -0.3 | 0.4 | -1.8 | -0.4 | 1.8 | -1.8 | 0.3 |
| 3037 | -1.4 | 27.2 | -26.7 | 1.2 | 24.2 | -1.5 | 1.6 | -24.4 | -2.5 | 38.9 | -38.7 | 2.5 | -0.1 | 2.3 | -2.4 | 0.1 | 2.4 | -0.1 | 0.1 | -2.3 |
| 3038 | -5.8 | 39.3 | -39.4 | 5.8 | -6 | 20.2 | -19.7 | 5.7 | 31.5 | -9.1 | 9.5 | -32.3 | 3.9 | -1.1 | 0.8 | -4 | -0.8 | 4 | -3.9 | 1.1 |
| 3040 | 18.5 | 0.2 | -0.8 | -18.4 | -6.7 | 21.2 | -21.1 | 7 | 33.7 | -11.1 | 10.6 | -33.9 | 2.2 | -1 | 0.8 | -2.2 | -0.8 | 2.2 | -2.2 | 1 |
| 3041 | 46.7 | -6.8 | 6.3 | -47.7 | -6.7 | 48.1 | -47.9 | 6.8 | 76.5 | -10.8 | 10.7 | -76.8 | 4.5 | -0.8 | 0.7 | -5.3 | -0.7 | 5.3 | -4.5 | 0.8 |
| 3047 | -5.9 | 46.3 | -45.9 | 6.7 | -3.2 | 23.2 | -22.6 | 3.4 | 36.1 | -5.3 | 5.2 | -37 | 4.4 | -0.7 | 0.5 | -4.8 | -0.5 | 4.8 | -4.4 | 0.7 |
| 3050 | 39.3 | -5.3 | 6 | -39.6 | -9.2 | 41.9 | -40.9 | 8.6 | 65.3 | -13.7 | 14.6 | -66.9 | 3.9 | -0.9 | 0.8 | -3.9 | -0.8 | 3.9 | -3.9 | 0.9 |
| 3051 | 3 | 22.4 | -21.7 | -2.9 | 19.9 | 3 | -3 | -20.4 | 4.7 | 32.6 | -31.7 | -4.8 | 0.2 | 1.9 | -2 | -0.2 | 2 | 0.2 | -0.2 | -1.9 |
| 3054 | 19.9 | 10 | -10.1 | -19.3 | 0.8 | 21.1 | -21.7 | -1.1 | 34.6 | 1.7 | -1.3 | -33.7 | -0.6 | 2.3 | -2.3 | 0.5 | 2.3 | -0.5 | 0.6 | -2.3 |
| 3055 | -1.3 | 26.2 | -25.8 | 1.1 | 26.9 | -1.6 | 1.7 | -27.1 | -2.7 | 43.2 | -43 | 2.6 | 3 | -0.2 | 0.2 | -2.9 | -0.2 | 2.9 | -3 | 0.2 |
| 3056 | -5.5 | 38.1 | -38.2 | 5.3 | -5.4 | 15.8 | -15.4 | 5.1 | 24.6 | -8.2 | 8.6 | -25.2 | -1.2 | 5.5 | -5.4 | 1.4 | 5.4 | -1.4 | 1.2 | -5.5 |
| 3058 | 18 | 0.2 | -1.1 | -17.9 | -6.4 | 23 | -22.9 | 6.8 | 36.6 | -10.9 | 10.3 | -36.7 | -1.1 | 2.9 | -2.8 | 1.3 | 2.8 | -1.3 | 1.1 | -2.9 |
| 3059 | 45.5 | -6.7 | 6.3 | -46.1 | -7.4 | 52.6 | -52.6 | 7.4 | 83.9 | -11.9 | 11.8 | -84 | -0.9 | 6.7 | -5.8 | 1 | 5.8 | -1 | 0.9 | -6.7 |
| 3065 | -5.9 | 44.4 | -44.5 | 6.5 | -2.5 | 18.2 | -17.5 | 2.6 | 27.9 | -4.1 | 4.1 | -29 | -0.8 | 6.6 | -6.1 | 1 | 6.1 | -1 | 0.8 | -6.6 |
| 3068 | 38.3 | -5.1 | 5.7 | -38.6 | -9.6 | 45.9 | -44.8 | 9 | 71.6 | -14.4 | 15.3 | -73.3 | -1.1 | 5.1 | -5.1 | 1.2 | 5.1 | -1.2 | 1.1 | -5.1 |
| 3069 | 2.7 | 22.1 | -21.5 | -2.7 | 22.2 | 3.3 | -3.2 | -22.9 | 5.1 | 36.5 | -35.5 | -5.2 | 2.4 | 0.3 | -0.3 | -2.4 | 0.3 | 2.4 | -2.4 | -0.3 |
| 3443 | 9.5 | -6.9 | 5 | -8.7 | -0.5 | 0.6 | -0.5 | 0.5 | 0.9 | -0.8 | 0.8 | -1 | 38.6 | -19.1 | 19.3 | -41.8 | -19.3 | 41.8 | -38.6 | 19.1 |
| 3445 | 22.3 | -13.5 | 12.5 | -22.9 | -0.4 | 0.5 | -0.5 | 0.5 | 0.7 | -0.7 | 0.7 | -0.8 | -16.2 | 42.1 | -38.6 | 16.7 | 38.6 | -16.7 | 16.2 | -42.1 |
| 3483 | 2.5 | 26.5 | -24.7 | -2.1 | 0.4 | 0.3 | -0.3 | -0.5 | 0.5 | 0.7 | -0.7 | -0.5 | 49.5 | -21.7 | 24.8 | -56.2 | -24.8 | 56.2 | -49.5 | 21.7 |
| 3484 | 15.1 | 17.3 | -15.3 | -15.3 | 0.6 | 0.1 | -0.1 | -0.6 | 0.1 | 1 | -0.9 | -0.1 | -17 | 58.9 | -52.4 | 14.7 | 52.4 | -14.7 | 17 | -58.9 |
| 3488 | 31.6 | -12.1 | 12.3 | -30.7 | -0.1 | 0.5 | -0.5 | 0.2 | 0.8 | -0.3 | 0.2 | -0.7 | 2.5 | 20.8 | -17.4 | -5.2 | 17.4 | 5.2 | -2.5 | -20.8 |
| 3489 | 36.6 | -8.5 | 10.1 | -36.9 | -0.2 | 0.6 | -0.6 | 0.2 | 1 | -0.3 | 0.4 | -1 | 16.9 | 20.2 | -16.9 | -20.1 | 16.9 | 20.1 | -16.9 | -20.2 |
| 3493 | 68.6 | -63.8 | 63.6 | -69 | -0.6 | 0.9 | -0.9 | 0.6 | 1.5 | -0.9 | 0.9 | -1.5 | -46 | 100.5 | -90.8 | 44.2 | 90.8 | -44.2 | 46 | -100.5 |
| 3494 | 60.6 | -32.8 | 36 | -60.7 | -1.3 | 1.3 | -1.3 | 1.3 | 2.1 | -2.1 | 2 | -2.1 | 77.7 | -27.7 | 30.3 | -87.6 | -30.3 | 87.6 | -77.7 | 27.7 |
| 3498 | 53.9 | -36.9 | 35.8 | -54.5 | 0 | 0.4 | -0.4 | -0.1 | 0.6 | 0.1 | 0 | -0.7 | -30.5 | 75 | -68.6 | 30.9 | 68.6 | -30.9 | 30.5 | -75 |
| 3499 | 38.3 | -22.8 | 23.8 | -37.9 | -0.3 | 0.7 | -0.7 | 0.3 | 1.1 | -0.5 | 0.5 | -1.1 | 60.7 | -20.6 | 20.8 | -67.1 | -20.8 | 67.1 | -60.7 | 20.6 |
| 3503 | -17 | 66.1 | -66.1 | 17.3 | 0.8 | -0.2 | 0.2 | -0.8 | -0.3 | 1.2 | -1.2 | 0.3 | 24 | -6.9 | 5.6 | -23.4 | -5.6 | 23.4 | -24 | 6.9 |
| 3504 | -13.3 | 66.3 | -66.3 | 13.1 | 0.9 | -0.3 | 0.3 | -1 | -0.4 | 1.5 | -1.5 | 0.4 | 2.2 | 17.6 | -17.2 | -1.2 | 17.2 | 1.2 | -2.2 | -17.6 |
| 3505 | -12.2 | 40.2 | -39.9 | 12.4 | 0.7 | -0.1 | 0.1 | -0.7 | -0.2 | 1.1 | -1.1 | 0.2 | 8.8 | 11.6 | -12.5 | -9.9 | 12.5 | 9.9 | -8.8 | -11.6 |
| 3554 | 23.8 | -13.5 | 14.5 | -22.4 | -0.1 | 0.6 | -0.6 | 0.1 | 0.9 | -0.2 | 0.1 | -0.9 | -17.4 | 33.8 | -36.9 | 17.5 | 36.9 | -17.5 | 17.4 | -33.8 |
| 3555 | 9.3 | -6.7 | 7.4 | -9.6 | 1.1 | -0.7 | 0.7 | -1 | -1.1 | 1.7 | -1.8 | 1.1 | 31.2 | -11 | 11.2 | -28.6 | -11.2 | 28.6 | -31.2 | 11 |
| 3558 | 19.6 | 14.8 | -16.4 | -19 | -0.2 | 1 | -1.2 | 0.4 | 1.9 | -0.6 | 0.4 | -1.7 | -17.1 | 41.5 | -46.5 | 19.1 | 46.5 | -19.1 | 17.1 | -41.5 |
| 3559 | -1.9 | 23.8 | -26.4 | 1.2 | 1.2 | -0.4 | 0.3 | -1.1 | -0.5 | 1.7 | -2 | 0.6 | 46.4 | -14.8 | 13.2 | -41.3 | -13.2 | 41.3 | -46.4 | 14.8 |
| 3562 | 30.9 | -8.7 | 8 | -31.4 | 0.6 | 0.2 | -0.3 | -0.5 | 0.5 | 0.7 | -0.9 | -0.3 | 12.9 | 5.2 | -7.3 | -10.5 | 7.3 | 10.5 | -12.9 | -5.2 |
| 3563 | 33 | -14.9 | 13.7 | -33.1 | 0.3 | 0.5 | -0.6 | -0.2 | 0.9 | 0.4 | -0.5 | -0.8 | 11.9 | 14.9 | -17.2 | -9.6 | 17.2 | 9.6 | -11.9 | -14.9 |
| 3566 | 51.6 | -35.8 | 34.4 | -52.4 | 2.5 | -0.9 | 0.8 | -2.2 | -1.3 | 3.4 | -3.9 | 1.4 | 69 | -28.1 | 26.8 | -61.9 | -26.8 | 61.9 | -69 | 28.1 |
| 3567 | 75.3 | -61.6 | 61.1 | -75.4 | -1.1 | 2.3 | -2.5 | 1.1 | 4 | -1.8 | 1.7 | -3.7 | -27.5 | 63.7 | -70.9 | 29.3 | 70.9 | -29.3 | 27.5 | -63.7 |
| 3568 | 32.5 | -6 | 6.5 | -33.1 | -0.2 | 1.1 | -1 | 0.1 | 1.6 | -0.2 | 0.4 | -1.8 | -5.5 | 22.9 | -21.3 | 2.1 | 21.3 | -2.1 | 5.5 | -22.9 |
| 3570 | 41 | -16.8 | 16.2 | -40.9 | 1.6 | -0.2 | 0.2 | -1.4 | -0.3 | 2.3 | -2.5 | 0.3 | 52.4 | -18.6 | 18.7 | -47.6 | -18.7 | 47.6 | -52.4 | 18.6 |
| 3571 | 51.5 | -40.9 | 41.5 | -51.3 | -1.2 | 2.1 | -2.3 | 1.2 | 3.7 | -1.9 | 1.9 | -3.4 | -19.5 | 49 | -53.8 | 19.7 | 53.8 | -19.7 | 19.5 | -49 |
| 3574 | -14.3 | 60.7 | -60.9 | 14.4 | 0.2 | 0.2 | -0.2 | -0.3 | 0.4 | 0.4 | -0.4 | -0.4 | -1.9 | 12.1 | -11.9 | 1.2 | 11.9 | -1.2 | 1.9 | -12.1 |
| 3575 | -17.4 | 70 | -70 | 17.2 | 0.9 | -0.3 | 0.4 | -0.9 | -0.6 | 1.5 | -1.4 | 0.5 | 17.3 | -3.1 | 3.9 | -17.1 | -3.9 | 17.1 | -17.3 | 3.1 |
| 3576 | -10 | 44.9 | -44.7 | 10 | 0.6 | 0.1 | -0.1 | -0.7 | 0.2 | 1.1 | -1 | -0.2 | 13 | 5.2 | -5.9 | -13.8 | 5.9 | 13.8 | -13 | -5.2 |
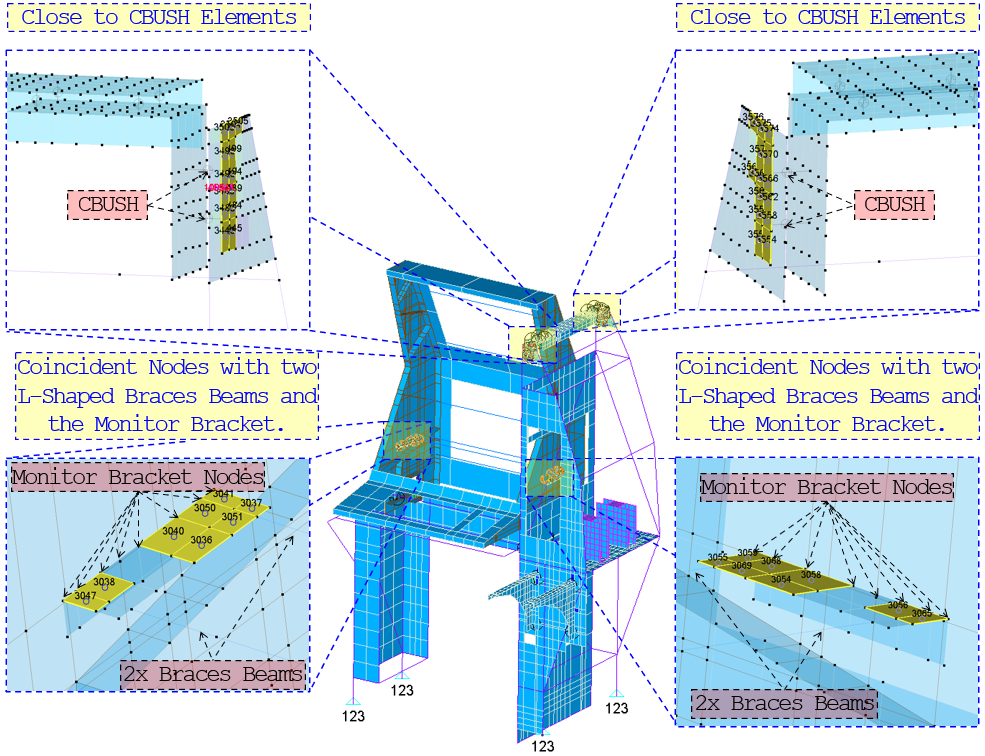
Excluding these elements from the failure assessment, a new maximum and minimum principal stresses for the structural sheet metal are determined and summarized in the applicable table. The maximum tensile and compressive principal stresses are 28.05 ksi and 28.3 ksi, respectively, and they belong to the forward load case.
New Maximum and Minimum Principal Stresses for the 2024-T3 ALCAD Sheets within the Starboard Workstation After Excluding the Flagged Elements. The highlighted cells represent the maximum tensile and compressive principal stresses.
| 2024-T3 ALCAD Sheet | FWD | UP | DOWN | IN | OUT | MAX Tension [ksi] |
MAX Compression [ksi] |
||||||
|---|---|---|---|---|---|---|---|---|---|---|---|---|---|
| F1 [ksi] |
F2 [ksi] |
F1 [ksi] |
F2 [ksi] |
F1 [ksi] |
F2 [ksi] |
F1 [ksi] |
F2 [ksi] |
F1 [ksi] |
F2 [ksi] |
||||
| Top | Tension | 27.83 | 14.46 | 11.88 | 5.83 | 20.13 | 10.15 | 27.09 | 8.99 | 21.25 | 10.42 | 28.05 | 28.30 |
| Compression | 14.30 | 28.27 | 6.36 | 12.61 | 9.31 | 18.96 | 10.42 | 21.25 | 8.99 | 27.09 | |||
| Bot | Tension | 28.05 | 13.6 | 12.71 | 6.31 | 19.24 | 8.35 | 20.63 | 10.45 | 24.81 | 8.99 | ||
| Compression | 13.45 | 28.3 | 5.23 | 12.05 | 10.07 | 20.3 | 8.99 | 24.81 | 10.45 | 20.63 | |||
The allowable ultimate tensile strength (Ftu) and allowable yield compressive strength (Fcy) for 2024-T3 ALCAD Sheets are 62 ksi and 37 ksi, respectively. The minimum margin of safety will be the lowest value between the tensile load MST and the compressive load MSC. These margins of safety can be expressed as below:
It is noteworthy that some of the remaining elements, despite falling within the threshold limits, may still reside in critical regions of the structure. However, they will be included in the failure assessment as part of a conservative methodology.
2024-T351 Plate
In the 2024-T351 Plate, a tensile and compressive threshold values are set to 30 ksi and -30 ksi, respectively. The table below lists the flagged elements that have principal stress values falling out of the set thresholds. The figure below shows the elements locations within the structure in the FEM.
The Flagged Elements within the 2024-T351 Plates that have Principal Stress Values Falling Out of the Set Thresholds
| ID | FWD | UP | DOWN | IN | OUT | |||||||||||||||
|---|---|---|---|---|---|---|---|---|---|---|---|---|---|---|---|---|---|---|---|---|
| F1 | F2 | F1 | F2 | F1 | F2 | F1 | F2 | F1 | F2 | |||||||||||
| T | B | T | B | T | B | T | B | T | B | T | B | T | B | T | B | T | B | T | B | |
| 2092 | 47.2 | -19.3 | 21.1 | -45.9 | -6.2 | 17.4 | -17.6 | 8.0 | 28.1 | -12.8 | 9.9 | -27.8 | 9.9 | -6.0 | 4.7 | -10.1 | -4.7 | 10.1 | -9.9 | 6.0 |
| 2341 | 51.3 | -17.7 | 25.6 | -48.5 | -3.8 | 15.1 | -14.8 | 7.6 | 23.6 | -12.2 | 6.1 | -24.1 | -3.3 | 10.2 | -10.5 | 7.3 | 10.5 | -7.3 | 3.3 | -10.2 |
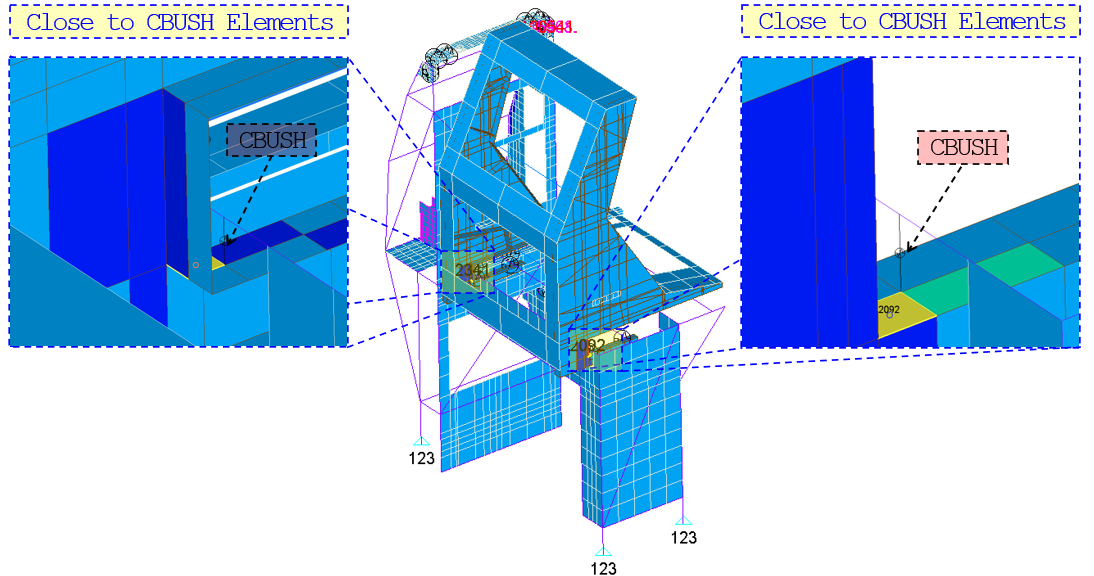
Excluding these elements from the failure assessment, a new maximum and minimum principal stresses for the structural sheet metal are determined and summarized in the applicable table. The maximum tensile and compressive principal stresses are 28.31 ksi and 28.09 ksi, respectively, and they belong to the forward load case.
New Maximum and Minimum Principal Stresses for the 2024-T351 Plates within the Starboard Workstation After Excluding the Flagged Elements. The highlighted cells represent the maximum tensile and compressive principal stresses.
| 2024-T351 Plate | FWD | UP | DOWN | IN | OUT | MAX Tension [ksi] |
MAX Compression [ksi] |
||||||
|---|---|---|---|---|---|---|---|---|---|---|---|---|---|
| F1 [ksi] |
F2 [ksi] |
F1 [ksi] |
F2 [ksi] |
F1 [ksi] |
F2 [ksi] |
F1 [ksi] |
F2 [ksi] |
F1 [ksi] |
F2 [ksi] |
||||
| Top | Tension | 28.31 | 9.33 | 7.13 | 2.69 | 14.81 | 4.02 | 19.39 | 13.22 | 23.61 | 7.90 | 28.31 | 28.09 |
| Compression | 9.47 | 15.10 | 2.52 | 9.28 | 4.29 | 11.38 | 7.90 | 23.61 | 13.22 | 19.39 | |||
| Bot | Tension | 19.32 | 5.89 | 9.19 | 4.01 | 10.46 | 4.64 | 23.68 | 7.92 | 19.74 | 8.33 | ||
| Compression | 11.96 | 28.09 | 2.9 | 6.55 | 6.41 | 14.67 | 8.33 | 19.74 | 7.92 | 23.68 | |||
The allowable ultimate tensile strength (Ftu) and allowable yield compressive strength (Fcy) for 2024-T351 Plate are 63 ksi and 39 ksi, respectively. The minimum margin of safety will be the lowest value between the tensile load MST and the compressive load MSC. These margins of safety can be expressed as below:
It is noteworthy that some of the remaining elements, despite falling within the threshold limits, may still reside in critical regions of the structure. However, they will be included in the failure assessment as part of a conservative methodology.
6061-T6&T6511 EXT
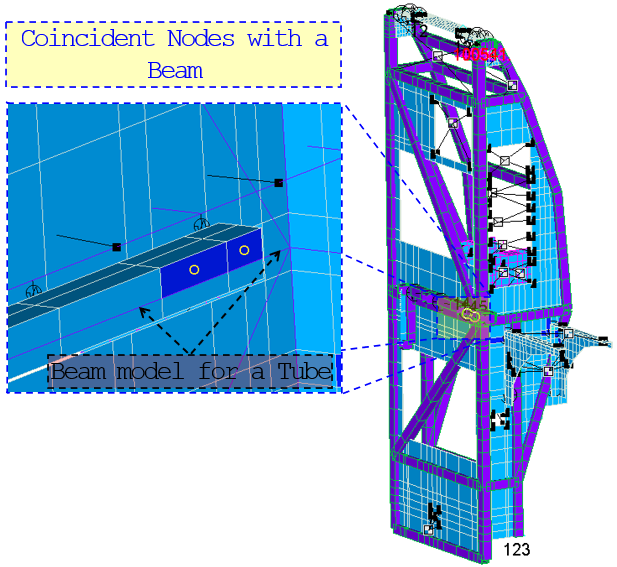
Excluding these elements from the failure assessment, a new maximum and minimum principal stresses for the structural sheet metal are determined and summarized in the applicable table. The maximum tensile and compressive principal stresses are 22.87 ksi and 24.35 ksi, respectively, and they belong to the forward load case.
New Maximum and Minimum Principal Stresses for the 6061-T6&T6511 EXT within the Starboard Workstation After Excluding the Flagged Elements. The highlighted cells represent the maximum tensile and compressive principal stresses.
| 6061-T6&T6511 EXT | FWD | UP | DOWN | IN | OUT | MAX Tension [ksi] |
MAX Compression [ksi] |
||||||
|---|---|---|---|---|---|---|---|---|---|---|---|---|---|
| F1 [ksi] |
F2 [ksi] |
F1 [ksi] |
F2 [ksi] |
F1 [ksi] |
F2 [ksi] |
F1 [ksi] |
F2 [ksi] |
F1 [ksi] |
F2 [ksi] |
||||
| Top | Tension | 22.87 | 10.32 | 3.24 | 1.47 | 7.50 | 1.89 | 10.23 | 4.22 | 16.32 | 4.03 | 22.87 | 24.35 |
| Compression | 6.82 | 13.28 | 1.18 | 4.70 | 2.35 | 5.17 | 4.03 | 16.32 | 4.22 | 10.23 | |||
| Bot | Tension | 14.57 | 4.91 | 5.74 | 1.93 | 4.92 | 1.73 | 19.34 | 6.15 | 9.65 | 2.55 | ||
| Compression | 8.03 | 24.35 | 1.08 | 3.08 | 3.08 | 9.16 | 2.55 | 9.65 | 6.15 | 19.34 | |||
The allowable ultimate tensile strength (Ftu) and allowable yield compressive strength (Fcy) for 6061-T6&T6511 EXT are 38 ksi and 34 ksi, respectively. The minimum margin of safety will be the lowest value between the tensile load MST and the compressive load MSC. These margins of safety can be expressed as below:
It is noteworthy that some of the remaining elements, despite falling within the threshold limits, may still reside in critical regions of the structure. However, they will be included in the failure assessment as part of a conservative methodology.
Composite Tables
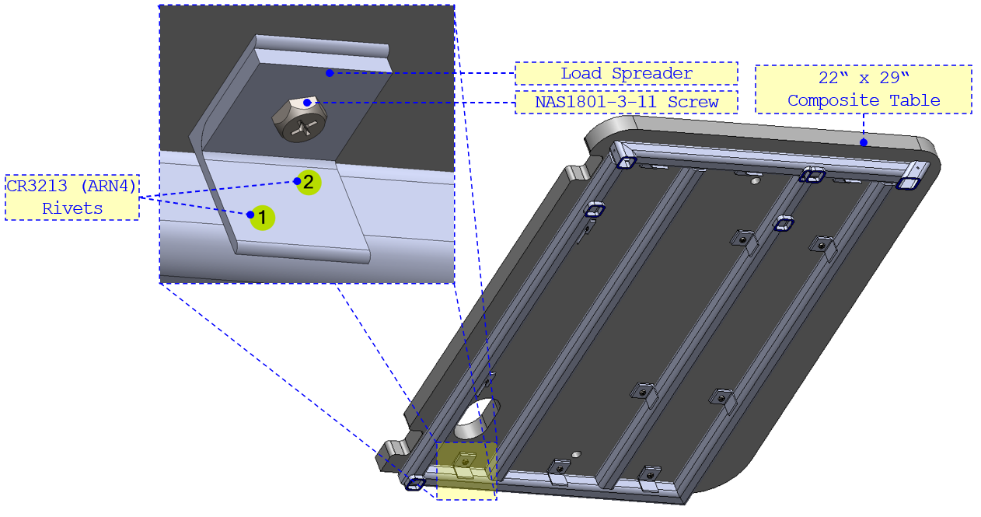
Main Tabletop
As shown in the corresponding figure, the 22” x 29” Main Tabletop is fixed to the tube structure at the four sides.
Conservatively, assuming that the weight of the mission computer plus the weight of the table itself (19.12 lb) act as a point load at the middle of the table, the resulted applied core shear stress, for the 6.8g download load case, can be calculates as follows:
The allowable core shear stress along the Short Beam Flexural ('W” and “L” directions) for TEKLAM AA207-33-1000 are 262 psi and 391 psi, respectively [Technical Data Sheet-TEKLAM AA207-33-1000]. Therefore, the table pass by observation.
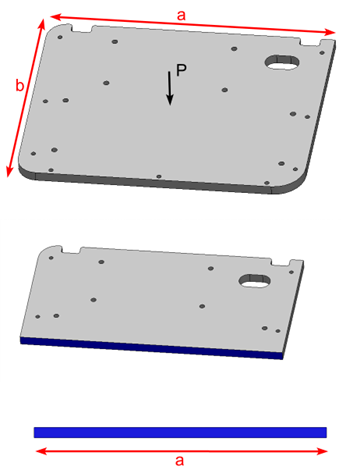
The face sheet bending stress will be calculated considering the maximum bending moments due to the applied load. For this purpose, As shown in the corresponding figure, the plate is considered as simply supported beam and the point load is applied at the middle of the beam.
The maximum bending moment due to applied load is:
The maximum bending stress can be calculated as below:
The allowable facing stress along the Long Beam Flexural ('W” and “L” directions) for TEKLAM AA207-33-1000 are 58.785 ksi and 57.986 ksi, respectively [Technical Data Sheet-TEKLAM AA207-33-1000]. Therefore, the table pass by observation.
It’s noteworthy that the core provides no contribution to the inertia except as a spacer. Therefore, the inertia of can be calculated as: , where A is the face sheet area, and d is the distance from the NA.
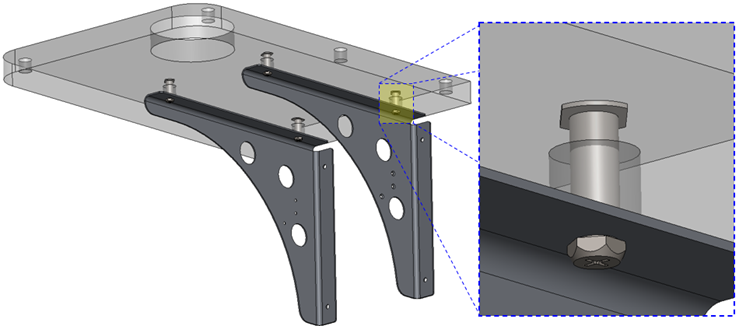
Side Tabletop
As shown in the corresponding figure, the 12” x 18” Side Tabletop is fixed to the Table Support Brackets at two sides, and the other two sides are left free.
Assuming that the weight of the side table (1.7 lb) acts as a point load at the middle of the table, the resulted applied core shear stress, for the 6.8g download load case, can be calculates as follows:
The allowable core shear stress along the Short Beam Flexural ('W” and “L” directions) for TEKLAM AA207-33-1000 are 262 psi and 391 psi, respectively [Technical Data Sheet-TEKLAM AA207-33-1000]. Therefore, the table pass by observation.
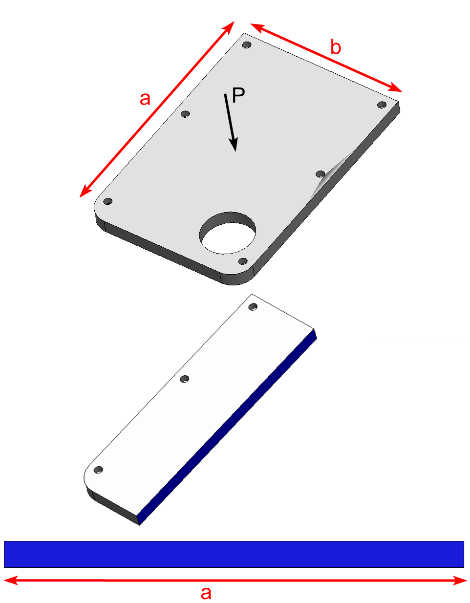
The face sheet bending stress will be calculated considering the maximum bending moments due to the applied load. For this purpose, As shown in the corresponding figure, the plate is considered as simply supported beam and the point load is applied at the middle of the beam.
The maximum bending moment due to applied load is:
The maximum bending stress can be calculated as below:
The allowable facing stress along the Long Beam Flexural ('W” and “L” directions) for TEKLAM AA207-33-1000 are 58.785 ksi and 57.986 ksi, respectively [Technical Data Sheet-TEKLAM AA207-33-1000]. Therefore, the table pass by observation.
It’s noteworthy that the core provides no contribution to the inertia except as a spacer. Therefore, the inertia of can be calculated as: , where A is the face sheet area, and d is the distance from the NA.
Workstation’s Attachment Points
Reaction forces components [lbf] at the Upper and Lower attachement points for all cases. The shear components are hilighted in grey
| ID | Location | FORWARD | UP | DOWN | INBOARD | OUTBOARD | ||||||||||
|---|---|---|---|---|---|---|---|---|---|---|---|---|---|---|---|---|
| X | Y | Z | X | Y | Z | X | Y | Z | X | Y | Z | X | Y | Z | ||
| 693 | Inboard, Lower, AFT | 285.83 | 41.49 | -48.67 | -2.05 | 4.52 | -151.45 | 3.27 | -7.21 | 241.75 | -11.13 | -73.92 | -32.42 | 11.13 | 73.92 | 32.42 |
| 690 | Inboard, Lower, FWD | 285.83 | -36.96 | 42.65 | -2.05 | 1.95 | -147.69 | 3.27 | -3.11 | 235.75 | -11.13 | -64.89 | -34.65 | 11.13 | 64.89 | 34.65 |
| 259 | Outboard, Lower, AFT | 102.55 | 54.85 | -67.18 | -7.88 | 4.53 | -147.27 | 12.57 | -7.23 | 235.08 | 11.83 | -80.03 | 21.13 | -11.83 | 80.03 | -21.13 |
| 79 | Outboard, Lower, FWD | 102.55 | -62.83 | 69.80 | -7.88 | 0.67 | -141.63 | 12.57 | -1.08 | 226.07 | 11.83 | -66.49 | 17.78 | -11.83 | 66.49 | -17.78 |
| 38378 | Outboard, Upper, AFT | 538.99 | 31.15 | -32.55 | 9.93 | -4.87 | -146.34 | -15.84 | 7.77 | 233.60 | -0.70 | -169.84 | 14.92 | 0.70 | 169.84 | -14.92 |
| 38377 | Outboard, Upper, FWD | 538.99 | -27.69 | 35.94 | 9.93 | -6.80 | -143.52 | -15.84 | 10.85 | 229.09 | -0.70 | -163.07 | 13.25 | 0.70 | 163.07 | -13.25 |
The Shear and Tensile Forces [lbf] Carried By the Studs for All Load Cases.
| ID | Location | FORWARD | UP | DOWN | INBOARD | OUTBOARD | |||||
|---|---|---|---|---|---|---|---|---|---|---|---|
| Shear | Tensile | Shear | Tensile | Shear | Tensile | Shear | Tensile | Shear | Tensile | ||
| 693 | Inboard, Lower, AFT | 336.25 | -2079.87 | 9.58 | -136.64 | 15.29 | 218.11 | 37.80 | 76.36 | 37.80 | -76.36 |
| 690 | Inboard, Lower, FWD | 374.90 | 2150.84 | 38.38 | -223.61 | 61.26 | 356.94 | 143.51 | 241.25 | 143.51 | -241.25 |
| 259 | Outboard, Lower, AFT | 289.16 | -189.69 | 31.40 | -365.93 | 50.13 | 584.11 | 201.40 | -257.85 | 201.40 | 257.85 |
| 79 | Outboard, Lower, FWD | 292.41 | 118.73 | 14.06 | -151.73 | 22.45 | 242.20 | 52.33 | -59.76 | 52.33 | 59.76 |
| MAX | 374.90 | 2150.84 | |||||||||
| 38378 | Outboard, Upper, AFT | 265.30 | 0.00 | 2.89 | 0.00 | 4.61 | 0.00 | 269.24 | 0.00 | 269.24 | 0.00 |
| 38377 | Outboard, Upper, FWD | 357.70 | 0.00 | 9.65 | 0.00 | 15.41 | 0.00 | 281.48 | 0.00 | 281.48 | 0.00 |
| MAX | 357.70 | ||||||||||
Upper and Lower Attachment Studs
Based on the applicable data, the maximum shear force carried by the Upper and Lower Studs are 357.70 lbf and 374.90 lbf, respectively, which belong to the forward load case. The upper attachment stud and the FE200744 seat track stud have ultimate load capacities of 481 lbf and 2,000 lbf, respectively. Therefore, the minimum margin of safety can be expressed as below:
Moreover, the maximum tensile force carried by the Lower Studs is 2150.84 lbf which belong to the forward load case. The FE200744 seat track stud has an ultimate tensile load capacity of 5,000 lbf. Therefore, this passes by observation.
Upper Seat Track Tooth
The maximum shear load carried by the upper stud is . Hence, the moment at the stud’s head caused by the shear force can be calculated as below:
At the tooth, the maximum reaction force at each tooth can be calculated as below:
Hence, the margin of safety can be calculated as below:
Lower Seat Track Tooth
Seat Track Stud
The Seat Track Stud is made from 1” thick AL 2024-T351 Plate. According to the applicable table, the highest load among lower attachment points passes through the FWD inboard Seat Track Stud. Due to the complex geometry, substantiation of this part is based on the non-linear FEM simulation.
The non-linear stress-strain properties of the material are shown on
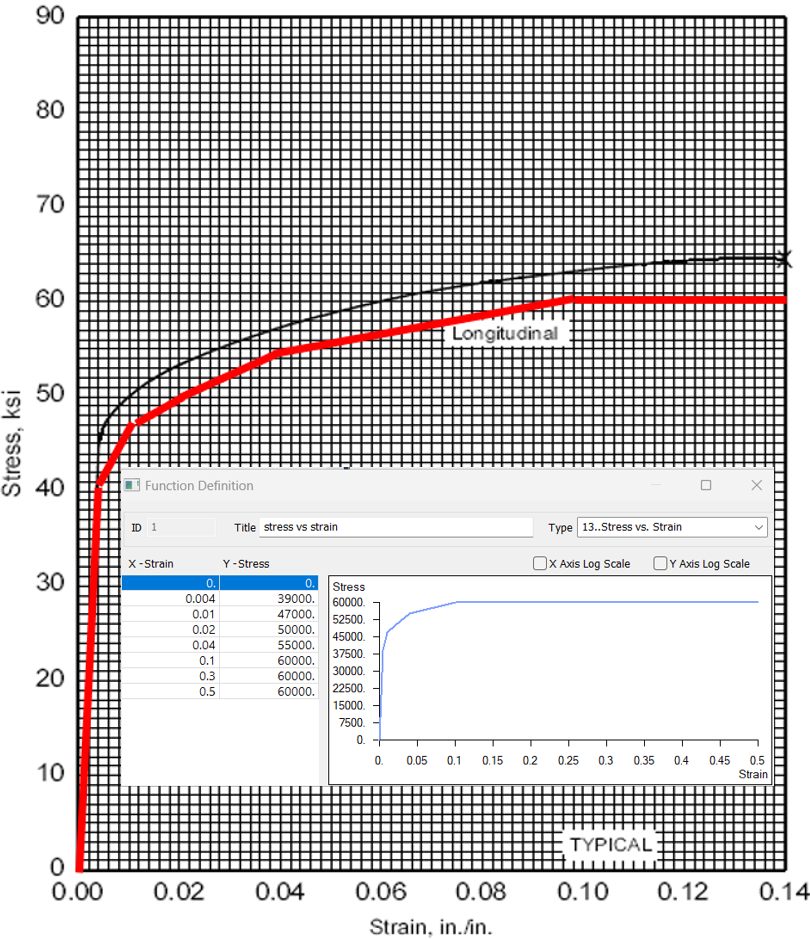
According to FEM results the highest strain is 0.0692in/in. According to
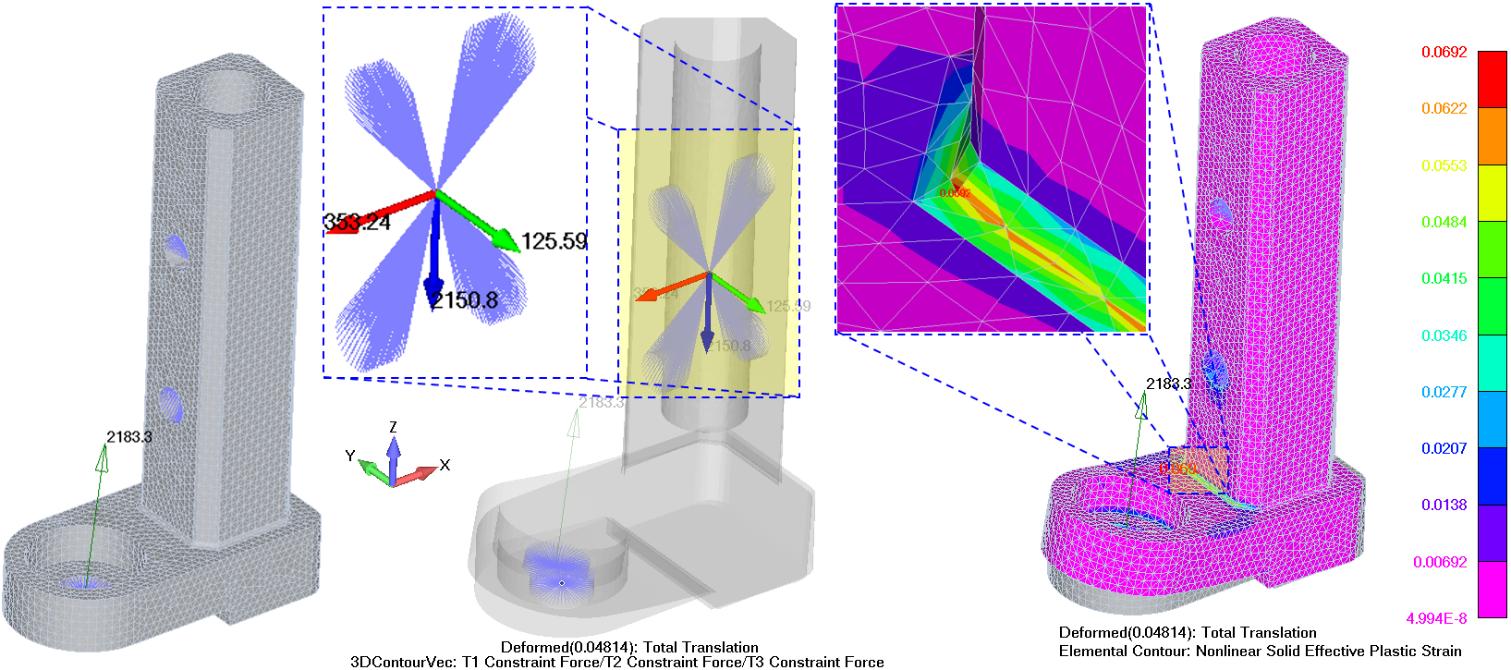
Two AN4-14A bolts are used to attach the stud to the tube structure. Hence, Based on the corresponding figure, the tensile and shear loads carried be each bolt can be calculated as below:
The Ultimate Tensile and Shear Strength for the AN4-14A bolt are 4,080 lbf and 3,436 lbf, respectively. Therefore, the fastener margin of safety can be calculated as below:
Workstation’s Panels
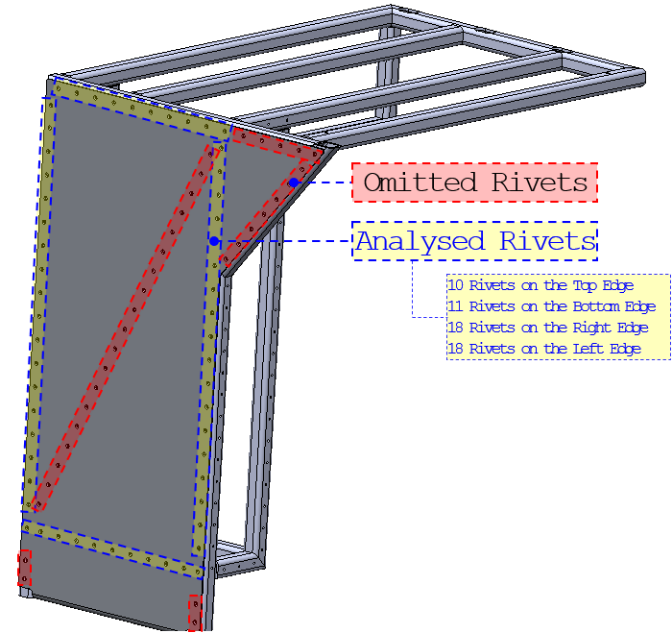
In the analysis of a panel attached to a tube structure with multiple rivets, a conservative approach has been adopted to ensure the design remains robust even under critical loading conditions. By intentionally omitting some rivets from the analysis, we account for potential factors such as uneven load distribution, rivet degradation, or installation variability. This approach effectively increases the load-bearing demand on the remaining rivets, providing a safety margin in the design. The rivets included in the analysis are considered representative of the most critical load paths, while those omitted are assumed to carry negligible or no load under worst-case scenarios. This methodology helps in simplifying the analysis without compromising structural integrity, ensuring a conservative yet practical assessment.
Side Desk Panel
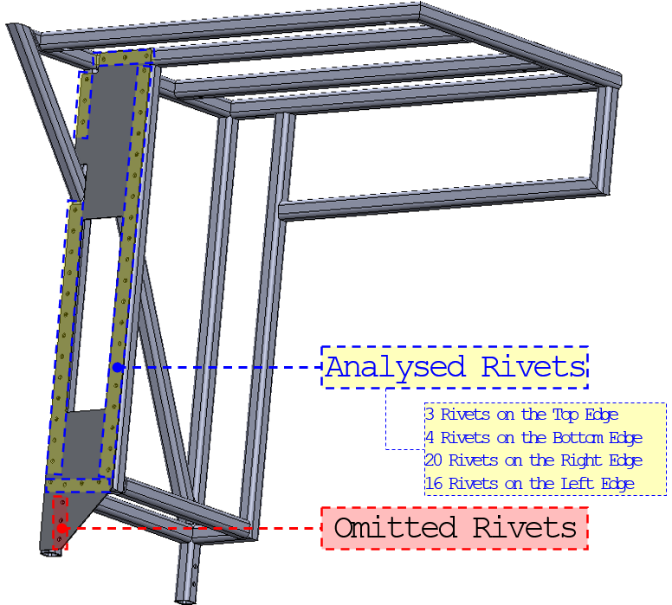
As shown in the corresponding figure, the Side desk panel is fixed to the tube structure through the 1/8” CR3212 (ARM4) Countersunk Rivets. The rivets omitted from the analysis are labelled as "Omitted Rivets", while those considered are labelled as "Analysed Rivets".
The figure below illustrates the Side Desk Panel’s Membrane Forces, Shear Flows, Shear Forces per unit length. Moreover, the applicable table and lists the maximum Membrane Forces, Shear Flows, and Shear Forces for all load cases. The maximum values of these forces belong to the forward load case, and it occurs at elements 1029, 1030, and 1589.
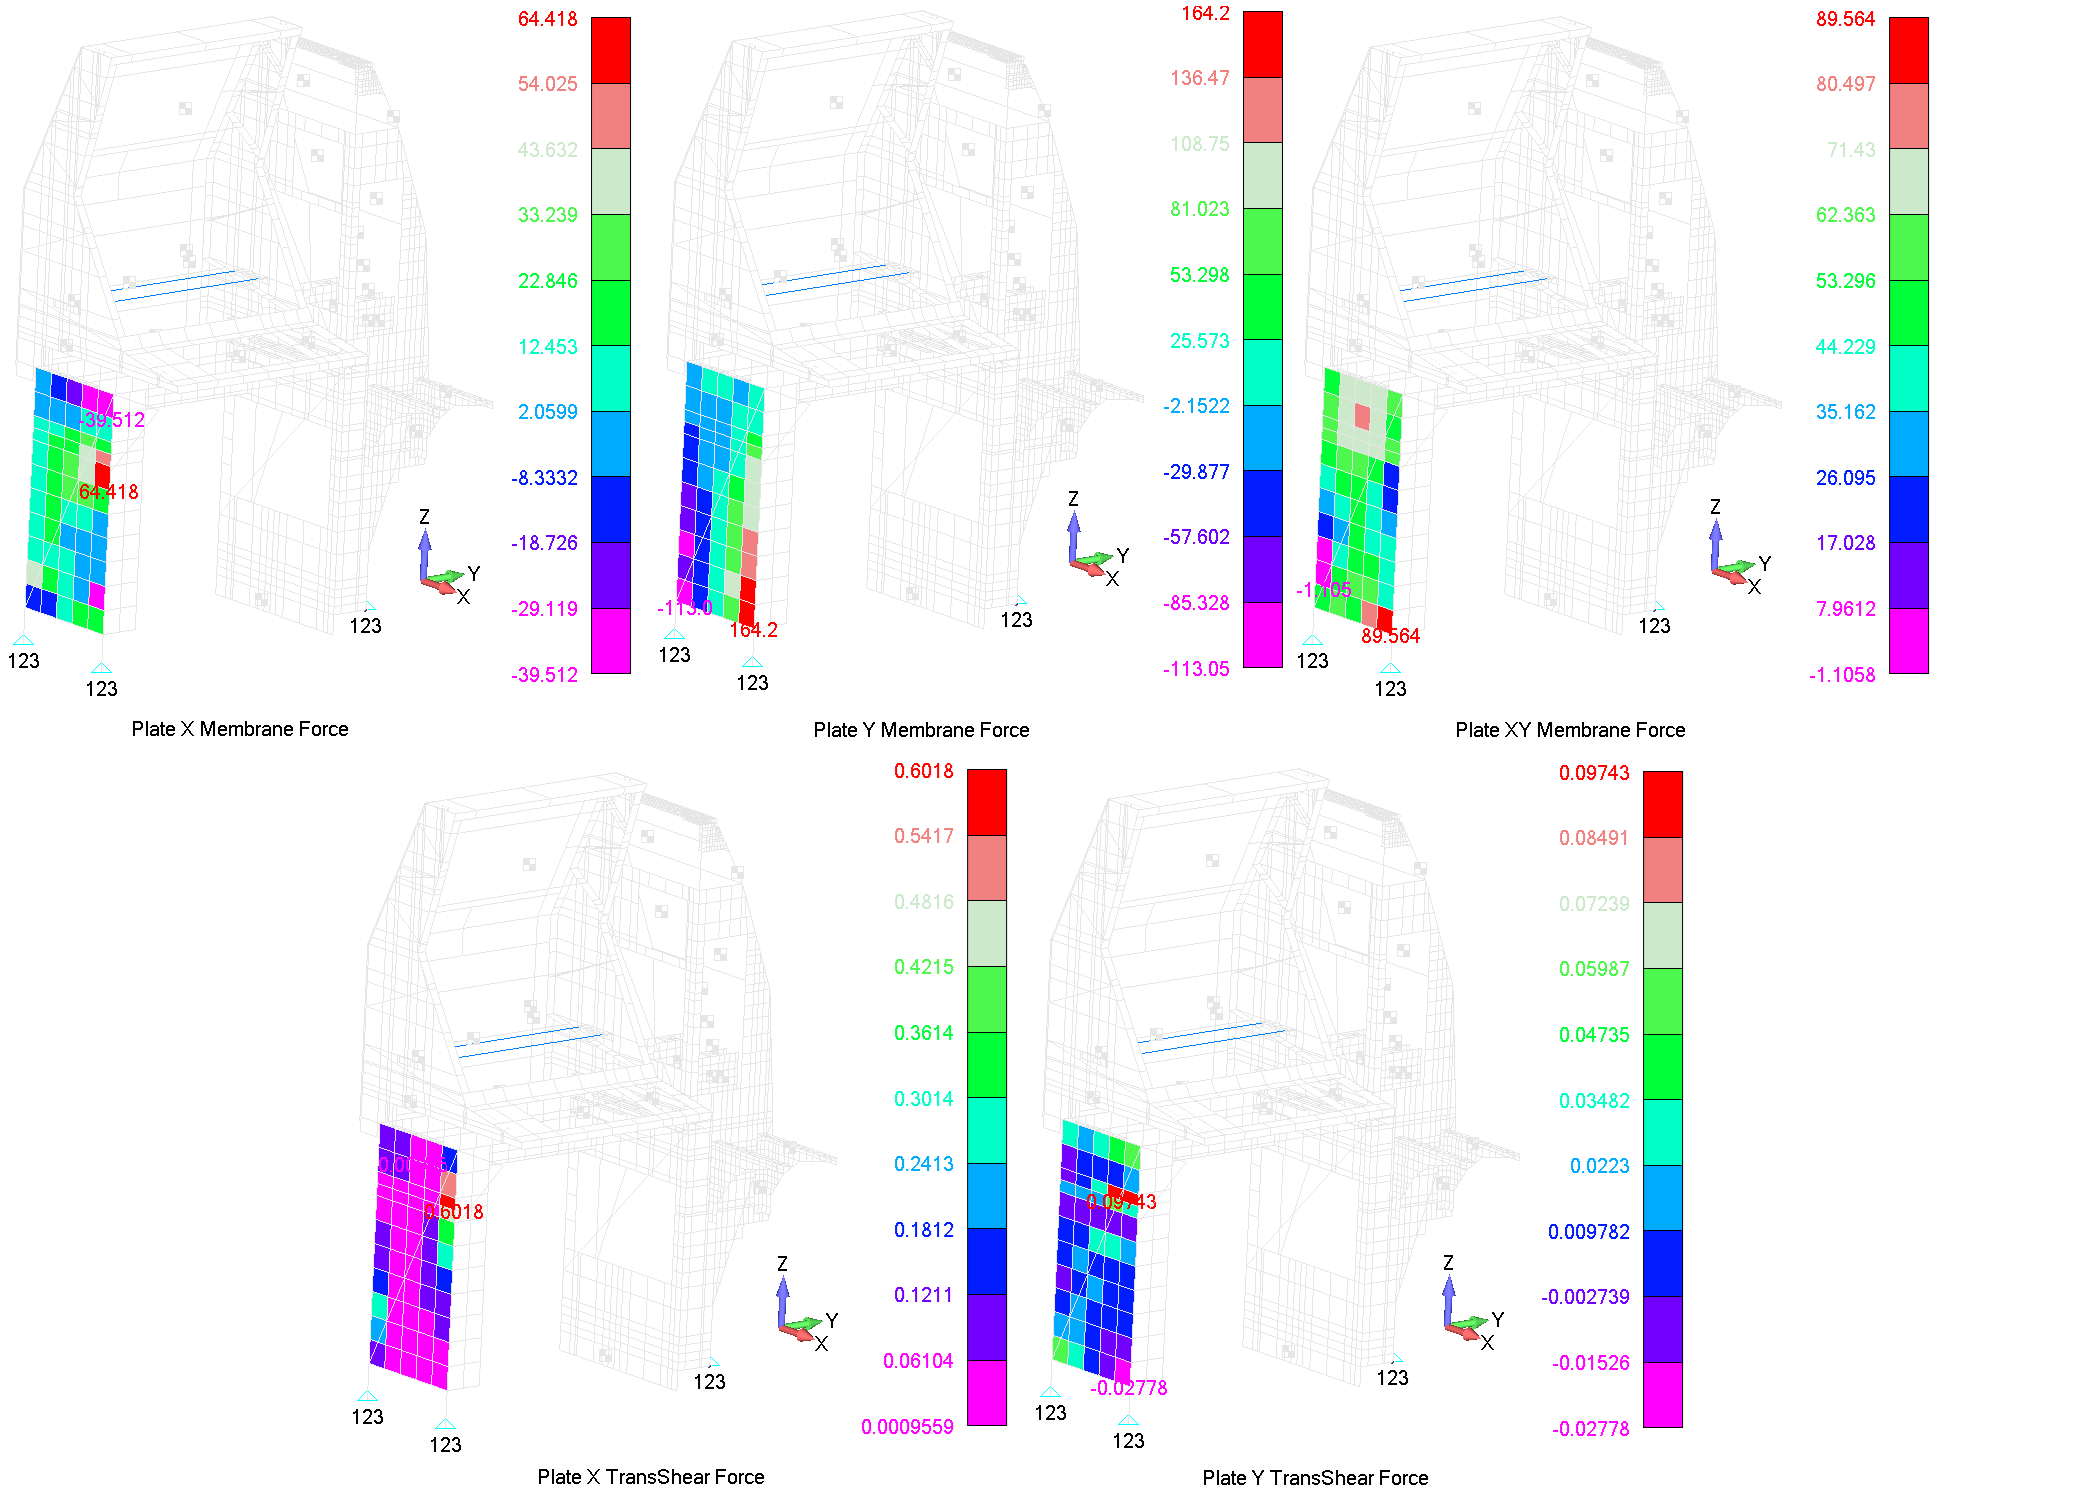
The Maximum Membrane Forces, Shear Flows, and Shear Forces [lbf] for all load cases, where the highlighted cells represent the maximum values.
| Nx on x-face | Ny on y-face | |||||||||
|---|---|---|---|---|---|---|---|---|---|---|
| FWD | UP | DOWN | INBD | OUTBD | FWD | UP | DOWN | INBD | OUTBD | |
| Max | 1,546.04 | 209.50 | 88.80 | 145.92 | 188.80 | 1,970.38 | 105.29 | 17.91 | 429.08 | 36.45 |
| Min | -948.30 | -55.63 | -334.41 | -188.80 | -145.91 | -1,356.63 | -11.22 | -168.07 | -36.45 | -429.08 |
| Nxy on x-face | Nxy on y-face | |||||||||
| FWD | UP | DOWN | INBD | OUTBD | FWD | UP | DOWN | INBD | OUTBD | |
| Max | 2,149.55 | 121.07 | 117.01 | 279.50 | 157.44 | 1,074.77 | 60.54 | 58.50 | 139.75 | 78.72 |
| Min | -26.54 | -73.30 | -193.26 | -157.44 | -279.50 | -13.27 | -36.65 | -96.63 | -78.72 | -139.75 |
| Qx on x-face | Qy on y-face | |||||||||
| FWD | UP | DOWN | INBD | OUTBD | FWD | UP | DOWN | INBD | OUTBD | |
| Max | 14.44 | 1.94 | 2.13 | 5.82 | 8.23 | 1.17 | 0.15 | 0.36 | 1.00 | 0.26 |
| Min | 0.02 | -1.34 | -3.10 | -8.23 | -5.82 | -0.33 | -0.23 | -0.23 | -0.26 | -1.00 |
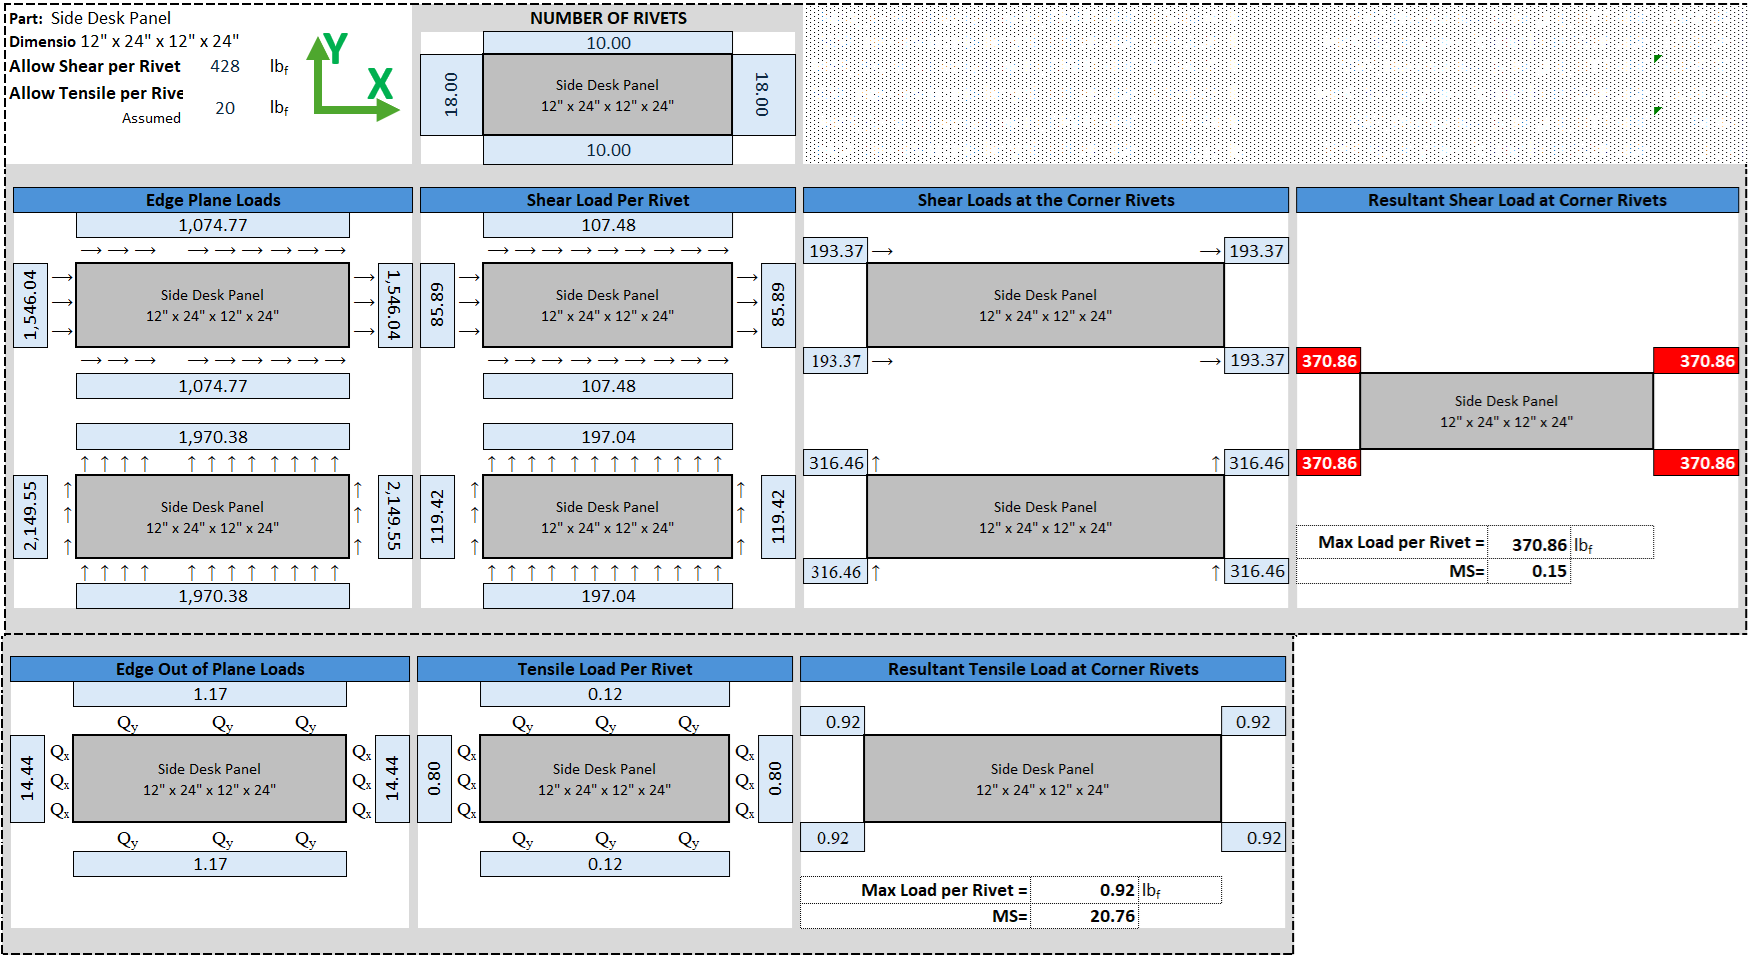
Conservatively, we will assume that these maximum values are the same for all edges in this panel and are carried by only the analysed rivets. As shown in the corresponding figure, the maximum tensile and shear values at the corner rivets are 0.92 lbf and 370.86 lbf, respectively. The rivet in this joint configuration has an ultimate tensile and shear strength values of ftu=285 lbf and fsu=428 lbf, respectively. Therefore, the rivet’s margin of safety against shear load can be expressed as below:
It is noteworthy that the rivets pass by observation against the tensile load.
Aft Desk Panel
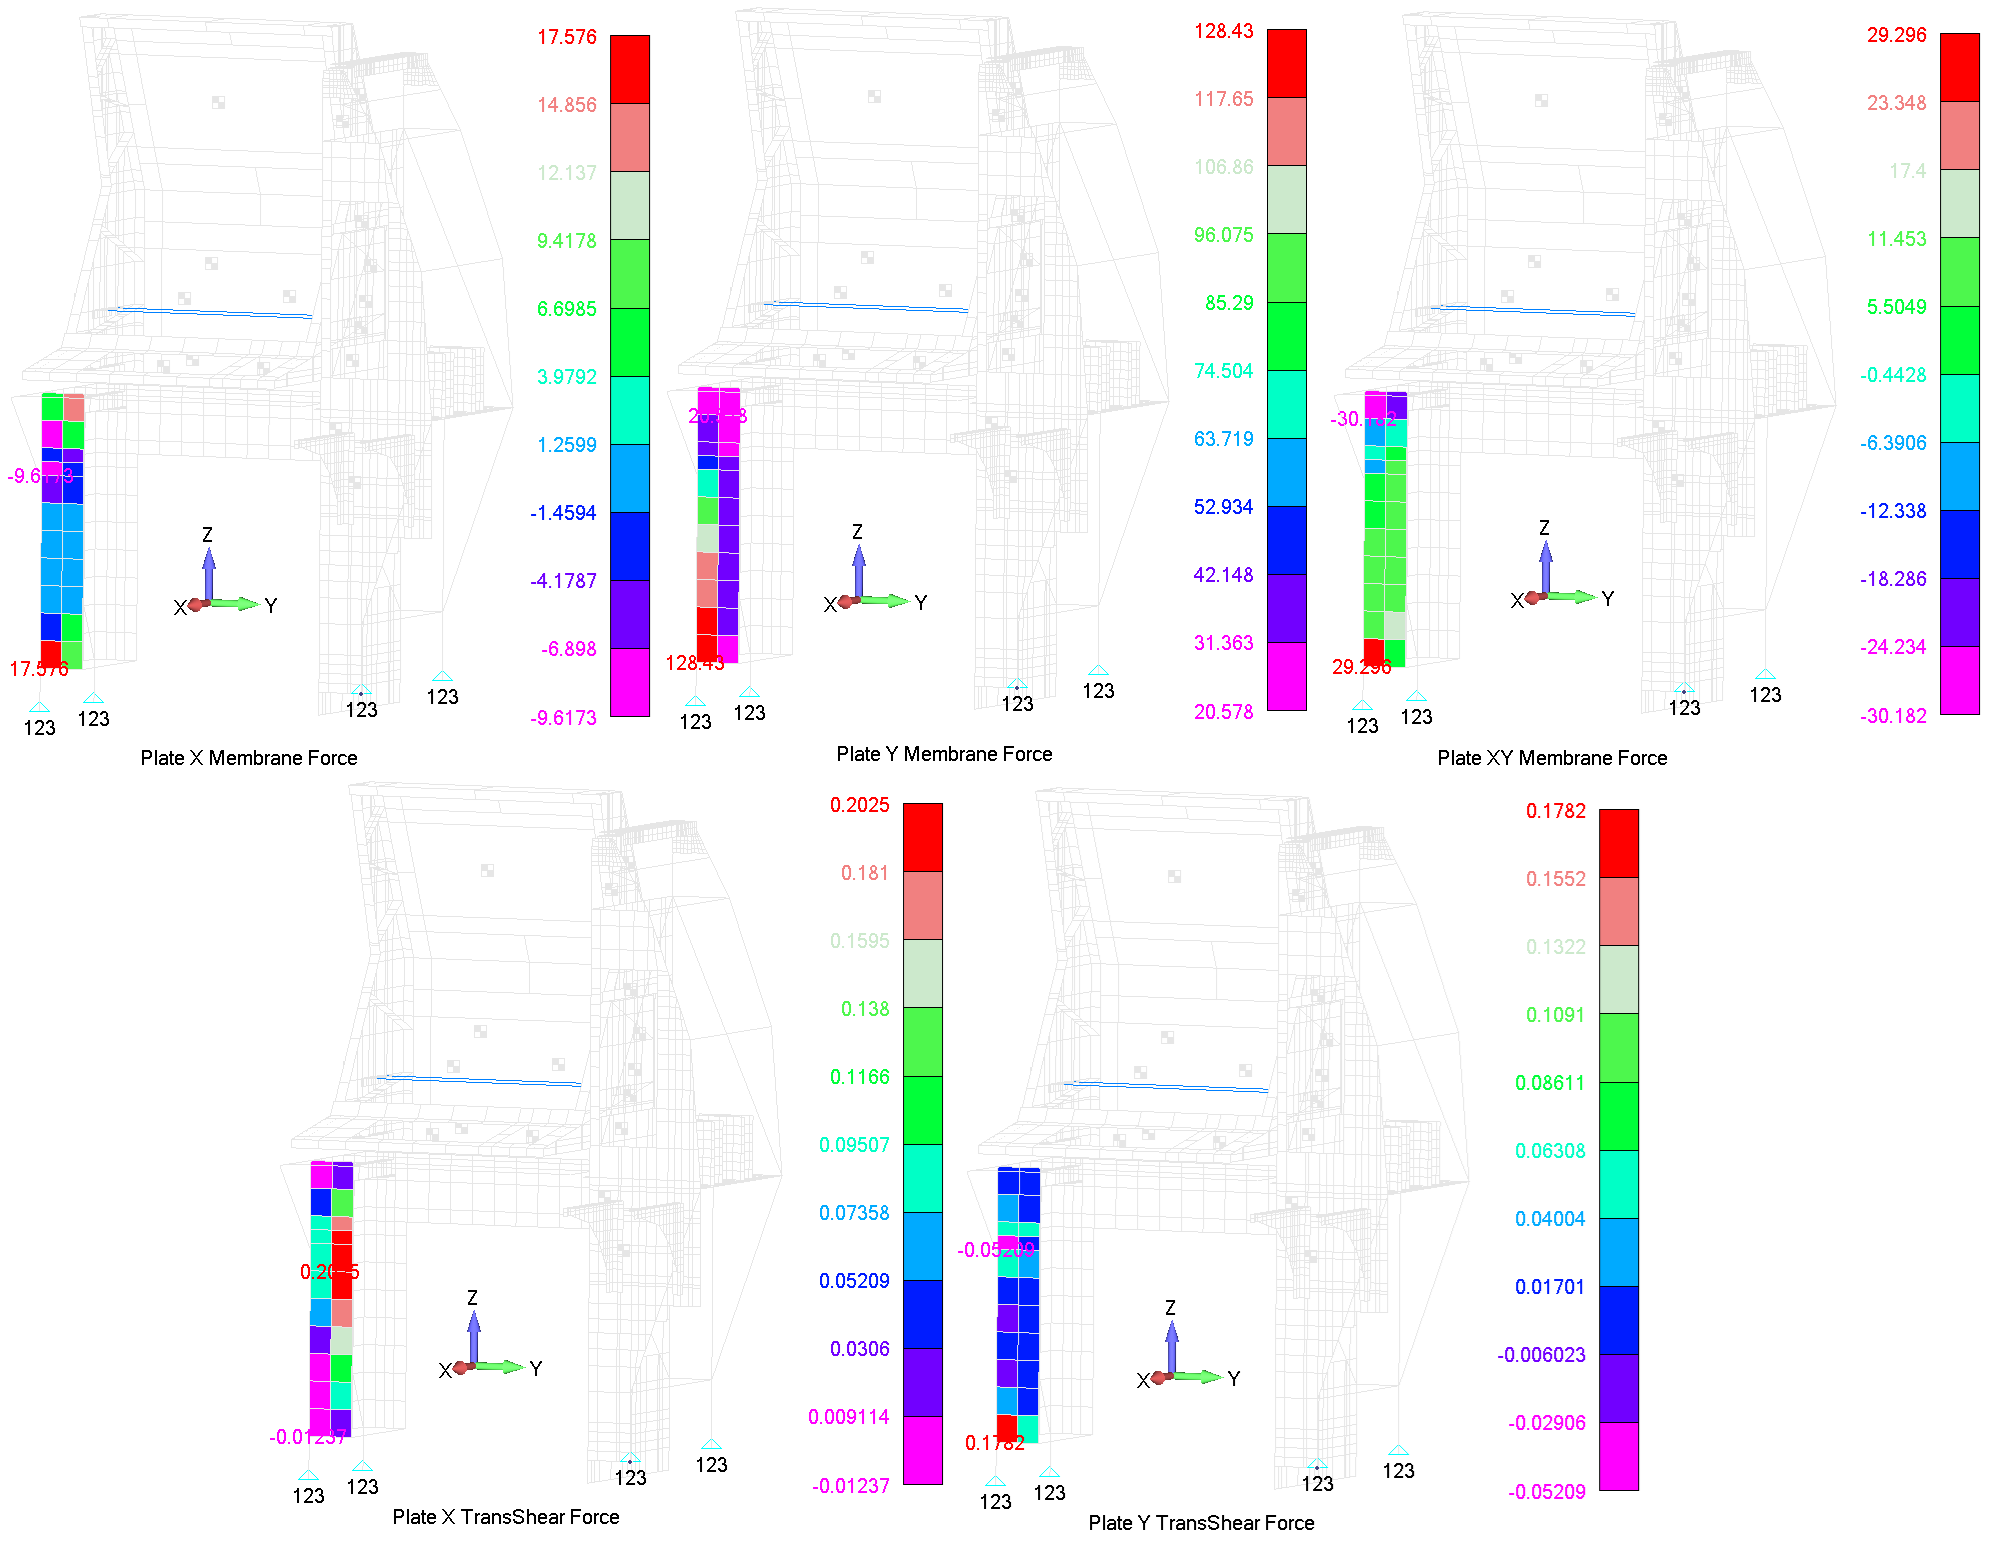
The Maximum Membrane Forces, Shear Flows, and Shear Forces [lbf] for all load cases, where the highlighted cells represent the maximum values.
| Nx on x-face | Ny on y-face | |||||||||
|---|---|---|---|---|---|---|---|---|---|---|
| FWD | UP | DOWN | INBD | OUTBD | FWD | UP | DOWN | INBD | OUTBD | |
| Max | 421.82 | 33.71 | 59.10 | 148.22 | 237.67 | 513.72 | 41.80 | -13.86 | 31.37 | 54.63 |
| Min | -230.81 | -37.03 | -53.81 | -237.67 | -148.22 | 82.31 | 8.68 | -66.72 | -54.63 | -31.37 |
| Nxy on x-face | Nxy on y-face | |||||||||
| FWD | UP | DOWN | INBD | OUTBD | FWD | UP | DOWN | INBD | OUTBD | |
| Max | 703.10 | 81.55 | 144.15 | 486.54 | 279.35 | 117.18 | 13.59 | 24.02 | 81.09 | 46.56 |
| Min | -724.36 | -90.30 | -130.17 | -279.35 | -486.54 | -120.73 | -15.05 | -21.70 | -46.56 | -81.09 |
| Qx on x-face | Qy on y-face | |||||||||
| FWD | UP | DOWN | INBD | OUTBD | FWD | UP | DOWN | INBD | OUTBD | |
| Max | 4.86 | 0.91 | -0.15 | -0.43 | 2.40 | 0.71 | 0.03 | 0.03 | 0.02 | 0.03 |
| Min | -0.30 | 0.10 | -1.46 | -2.40 | 0.43 | -0.21 | -0.02 | -0.05 | -0.03 | -0.02 |
Conservatively, we will assume that these maximum values are the same for all edges in this panel and are carried by only two rivets at the top and bottom edges, and ten rivets at the left and right edges. The maximum tensile and shear values at the corner rivets are 0.84 lbf and 344.89 lbf, respectively. The rivet in this joint configuration has an ultimate tensile and shear strength values of ftu=285 lbf and fsu=428 lbf, respectively. Therefore, the rivet’s margin of safety against shear load can be expressed as below:
It is noteworthy that the rivets pass by observation against the tensile load.
FWD Desk Panel
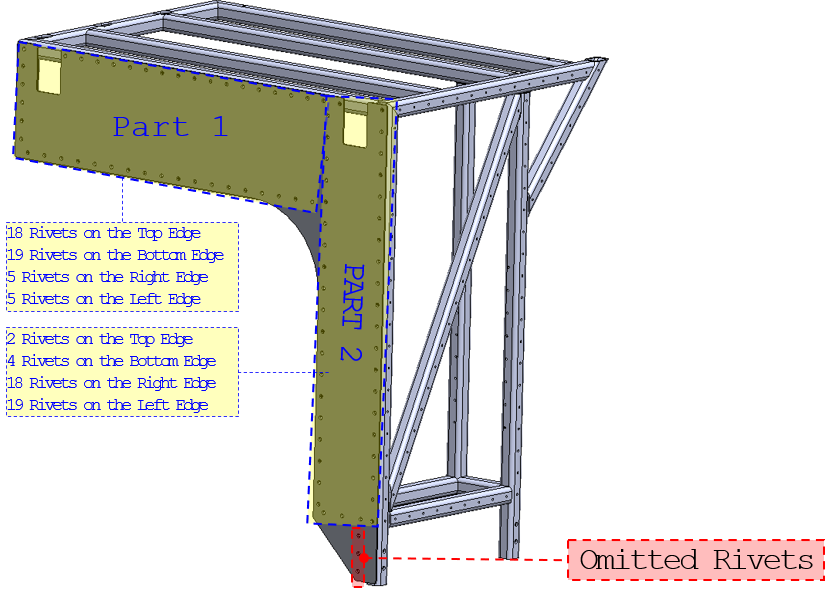
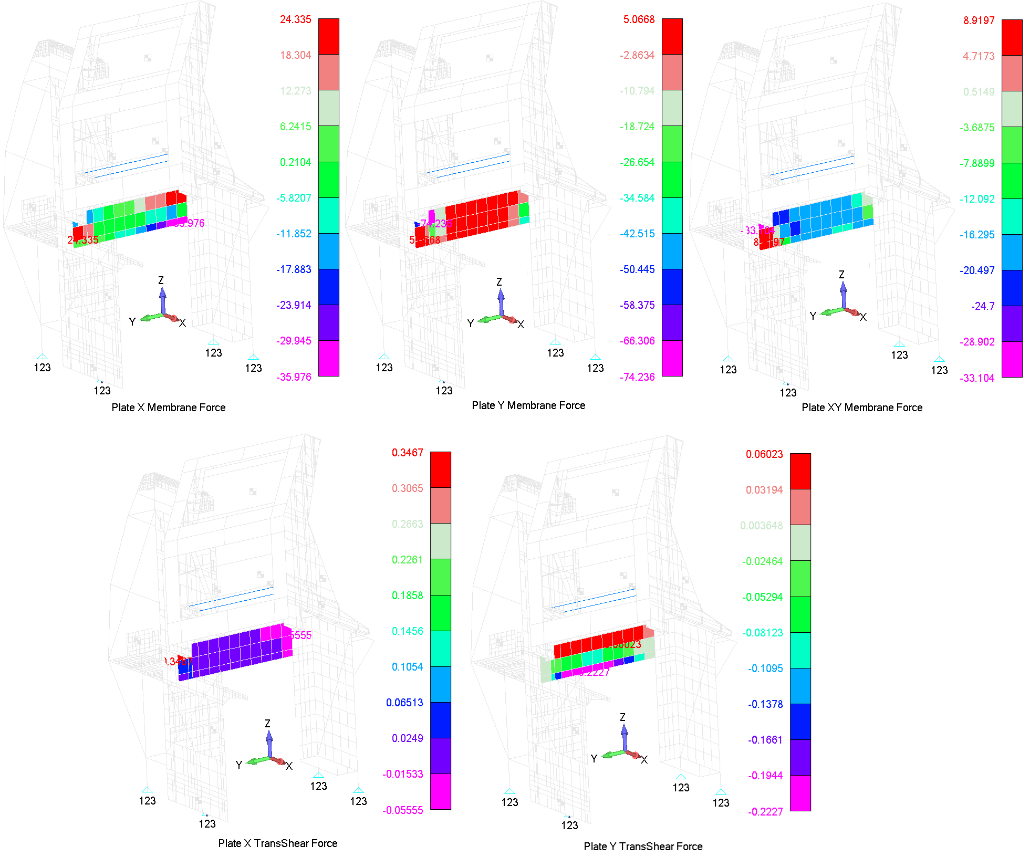
The Maximum Membrane Forces, Shear Flows, and Shear Forces [lbf] for all load cases in Part 1 of the FWD Desk Panel, where the highlighted cells represent the maximum values.
| Nx on x-face | Ny on y-face | |||||||||
|---|---|---|---|---|---|---|---|---|---|---|
| FWD | UP | DOWN | INBD | OUTBD | FWD | UP | DOWN | INBD | OUTBD | |
| Max | 146.01 | 65.66 | 70.22 | 257.09 | 362.28 | 116.54 | 546.44 | 80.53 | 903.09 | 1,349.96 |
| Min | -215.86 | -43.99 | -104.81 | -362.28 | -257.09 | -1,707.42 | -50.45 | -872.25 | -1,349.97 | -903.09 |
| Nxy on x-face | Nxy on y-face | |||||||||
| FWD | UP | DOWN | INBD | OUTBD | FWD | UP | DOWN | INBD | OUTBD | |
| Max | 53.52 | 69.01 | 58.81 | 170.23 | 243.31 | 205.15 | 264.53 | 225.42 | 652.55 | 932.70 |
| Min | -198.63 | -36.84 | -110.16 | -243.31 | -170.23 | -761.40 | -141.22 | -422.26 | -932.70 | -652.55 |
| Qx on x-face | Qy on y-face | |||||||||
| FWD | UP | DOWN | INBD | OUTBD | FWD | UP | DOWN | INBD | OUTBD | |
| Max | 2.08 | 0.27 | 0.01 | 1.19 | 0.12 | 1.39 | 0.14 | 0.37 | 0.23 | 1.58 |
| Min | -0.33 | -0.01 | -0.43 | -0.12 | -1.19 | -5.12 | -0.23 | -0.22 | -1.58 | -0.23 |
Conservatively, we will assume that these maximum values are the same for all edges in this panel and are carried by only ten rivets at the top and bottom edges, and two rivets at the left and right edges. The maximum tensile and shear values at the corner rivets are 1.55 lbf and 401 lbf, respectively. The rivet in this joint configuration has an ultimate tensile and shear strength values of ftu=285 lbf and fsu=428 lbf, respectively. Therefore, the rivet’s margin of safety against shear load can be expressed as below:
It is noteworthy that the rivets pass by observation against the tensile load.
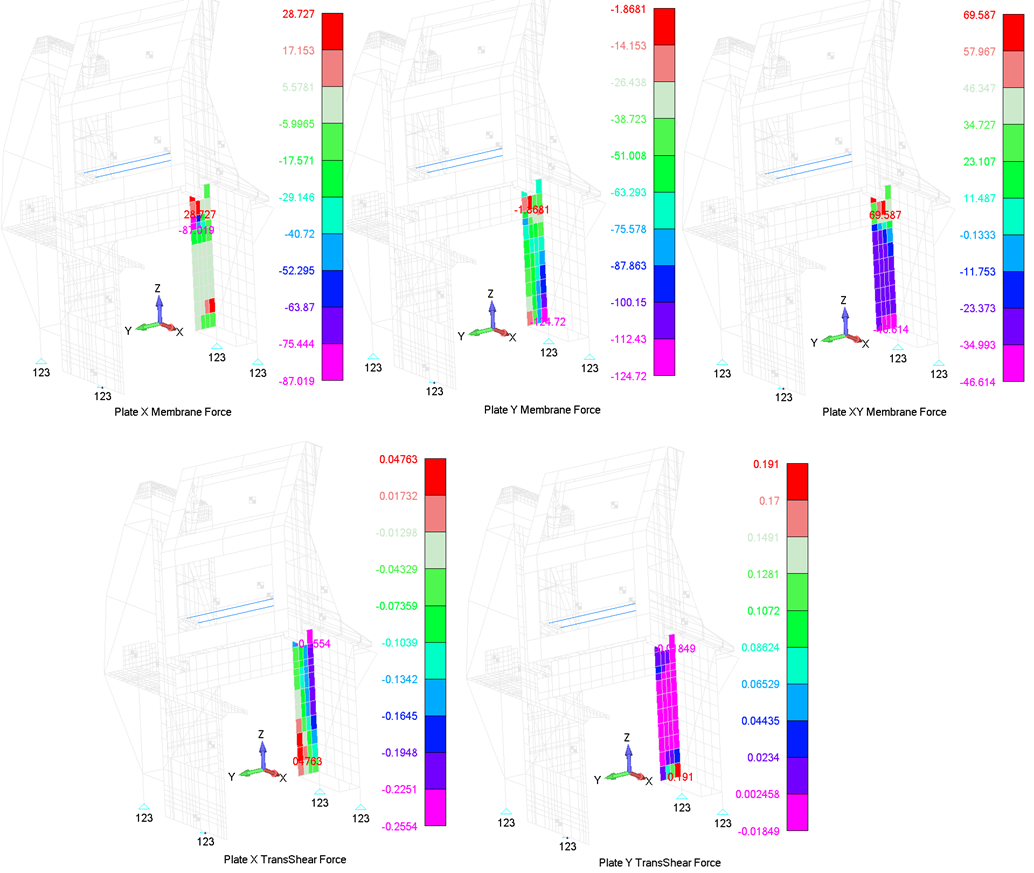
The Maximum Membrane Forces, Shear Flows, and Shear Forces [lbf] for all load cases in Part 2 of the FWD Desk Panel, where the highlighted cells represent the maximum values.
| Nx on x-face | Ny on y-face | |||||||||
|---|---|---|---|---|---|---|---|---|---|---|
| FWD | UP | DOWN | INBD | OUTBD | FWD | UP | DOWN | INBD | OUTBD | |
| Max | 689.46 | 651.64 | 332.74 | 1,200.31 | 3,504.90 | -7.47 | 105.22 | 11.15 | 144.25 | 396.83 |
| Min | -2,088.45 | -208.45 | -1,040.17 | -3,504.91 | -1,200.31 | -498.87 | -6.98 | -167.96 | -396.83 | -144.25 |
| Nxy on x-face | Nxy on y-face | |||||||||
| FWD | UP | DOWN | INBD | OUTBD | FWD | UP | DOWN | INBD | OUTBD | |
| Max | 1,670.09 | 359.05 | 816.85 | 2,954.90 | 1,359.11 | 278.35 | 59.84 | 136.14 | 492.48 | 226.52 |
| Min | -1,118.72 | -511.74 | -573.14 | -1,359.12 | -2,954.89 | -186.45 | -85.29 | -95.52 | -226.52 | -492.48 |
| Qx on x-face | Qy on y-face | |||||||||
| FWD | UP | DOWN | INBD | OUTBD | FWD | UP | DOWN | INBD | OUTBD | |
| Max | 1.14 | 0.10 | 1.37 | 3.84 | 2.57 | 0.76 | 0.00 | 0.04 | 0.02 | 0.02 |
| Min | -6.13 | -0.86 | -0.16 | -2.57 | -3.84 | -0.07 | -0.03 | 0.00 | -0.02 | -0.02 |
Conservatively, we will assume that these maximum values are the same for all edges in this panel and are carried by only two rivets at the top and bottom edges, and seven rivets at the left and right edges. The maximum tensile and shear values at the corner rivets are -0.49 lbf (compression) and 307.53 lbf, respectively. The rivet in this joint configuration has an ultimate tensile and shear strength values of ftu=285 lbf and fsu=428 lbf, respectively. Therefore, the rivet’s margin of safety against shear load can be expressed as below:
It is noteworthy that the rivets pass by observation against the tensile load.
Inboard Tower Skin Panel
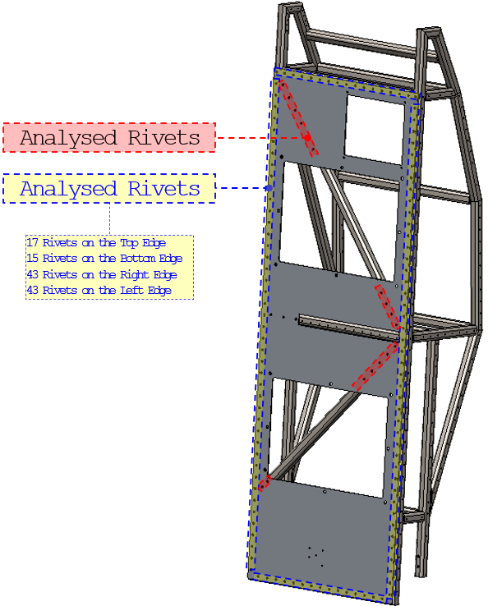
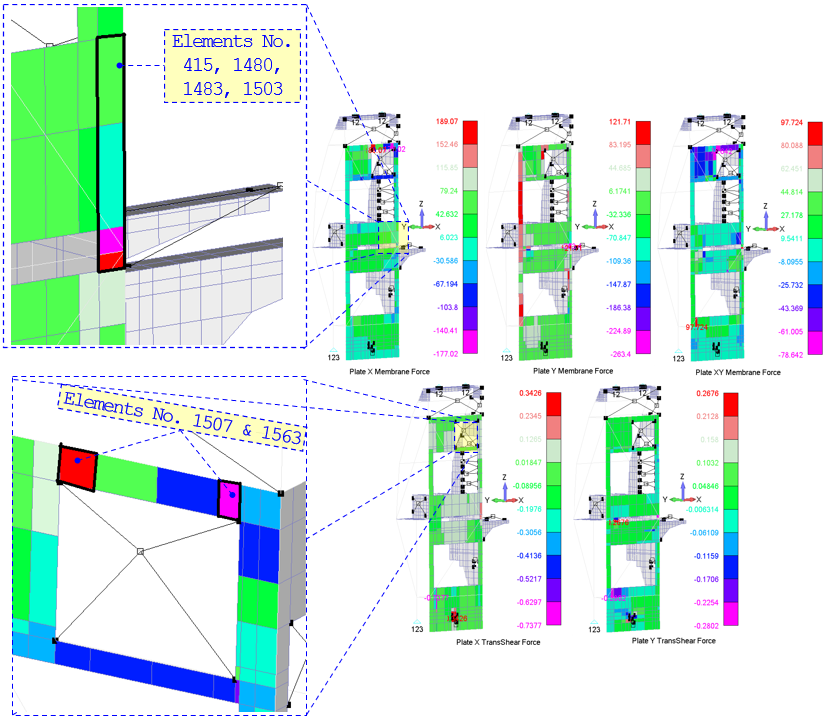
The Maximum Membrane Forces, Shear Flows, and Shear Forces [lbf] for all load cases, where the highlighted cells represent the maximum values.
| Nx on x-face | Ny on y-face | |||||||||
|---|---|---|---|---|---|---|---|---|---|---|
| FWD | UP | DOWN | INBD | OUTBD | FWD | UP | DOWN | INBD | OUTBD | |
| Max | 4,488.07 | 1,091.44 | 1,782.84 | 2,915.25 | 2,847.32 | 2,138.32 | 918.41 | 1,387.33 | 2,306.50 | 2,059.28 |
| Min | -5,403.73 | -1,116.90 | -1,742.20 | -2,847.33 | -2,915.24 | -3,214.74 | -869.12 | -1,466.00 | -2,059.28 | -2,306.50 |
| Nxy on x-face | Nxy on y-face | |||||||||
| FWD | UP | DOWN | INBD | OUTBD | FWD | UP | DOWN | INBD | OUTBD | |
| Max | 4,886.21 | 736.09 | 1,296.65 | 1,288.36 | 1,754.87 | 1,759.03 | 264.99 | 466.79 | 463.81 | 631.75 |
| Min | -3,419.22 | -812.31 | -1,174.98 | -1,754.88 | -1,288.36 | -1,230.92 | -292.43 | -422.99 | -631.76 | -463.81 |
| Qx on x-face | Qy on y-face | |||||||||
| FWD | UP | DOWN | INBD | OUTBD | FWD | UP | DOWN | INBD | OUTBD | |
| Max | 17.13 | 4.34 | 7.38 | 15.98 | 25.64 | 4.82 | 3.88 | 3.96 | 18.23 | 3.80 |
| Min | -36.89 | -4.62 | -6.93 | -25.64 | -15.98 | -5.04 | -2.48 | -6.19 | -3.80 | -18.23 |
Conservatively, we will assume that these maximum values are the same for all edges in this panel. The maximum tensile and shear values at the corner rivets are 2.07 lbf and 408.13 lbf, respectively. The rivet in this joint configuration has an ultimate tensile and shear strength values of ftu=285 lbf and fsu=428 lbf, respectively. Therefore, the rivet’s margin of safety against shear load can be expressed as below:
It is noteworthy that the rivets pass by observation against the tensile load.
AFT Tower Skin Panel
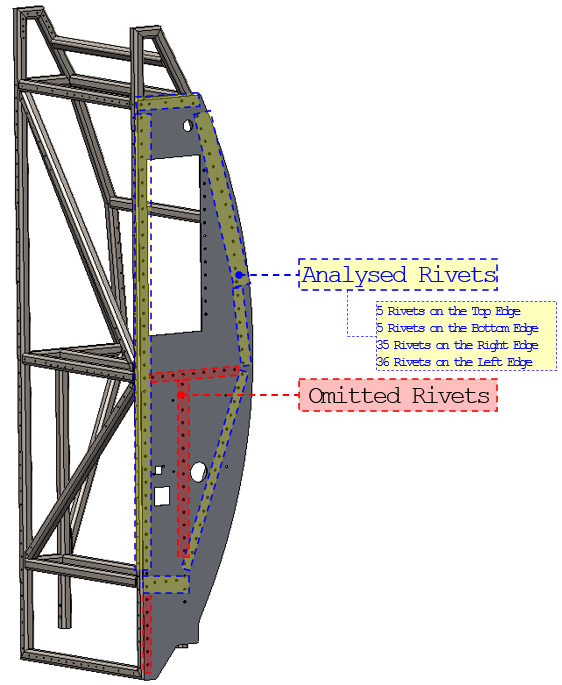
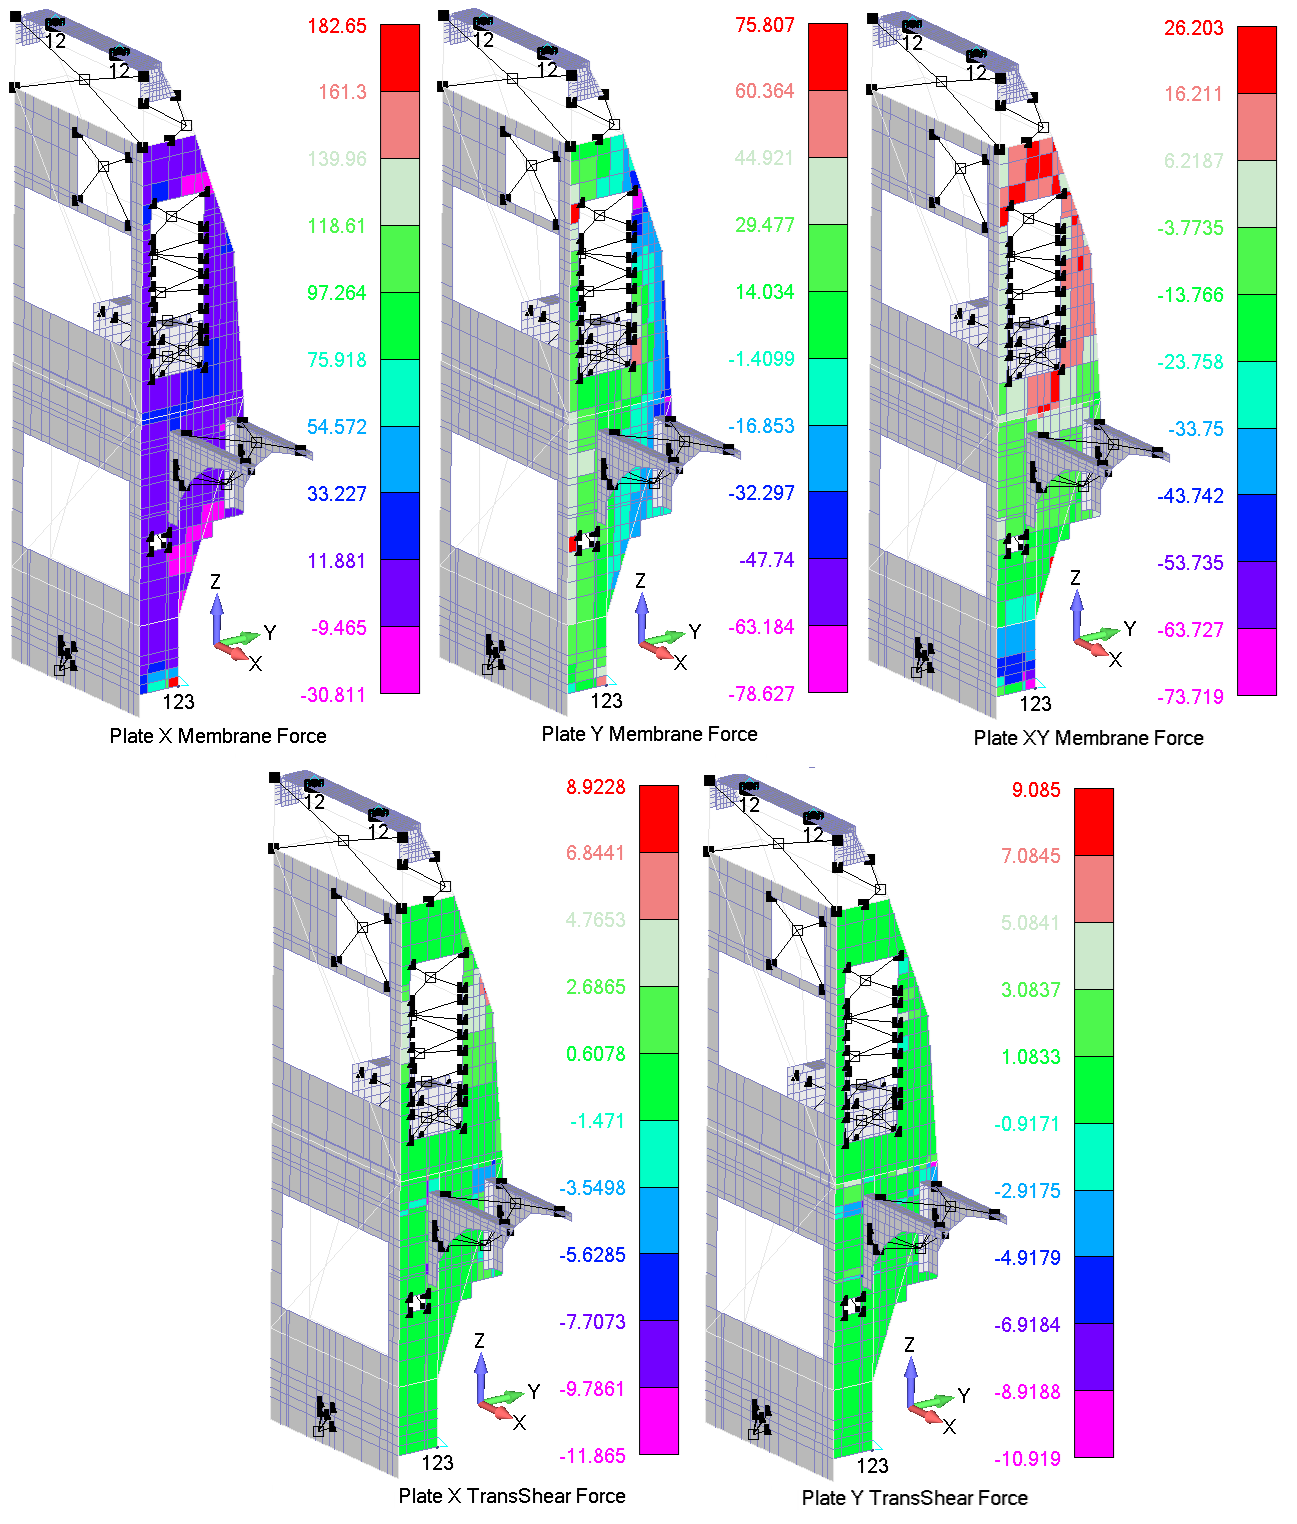
The Maximum Membrane Forces, Shear Flows, and Shear Forces [lbf] for all load cases.
| Nx on x-face | Ny on y-face | |||||||||
|---|---|---|---|---|---|---|---|---|---|---|
| FWD | UP | DOWN | INBD | OUTBD | FWD | UP | DOWN | INBD | OUTBD | |
| Max | 2,425.05 | 1,242.95 | 1,039.20 | 8,999.03 | 1,518.04 | 233.51 | 214.43 | 70.75 | 405.57 | 420.65 |
| Min | -1,135.50 | -651.03 | -1,984.04 | -1,518.05 | -8,999.00 | -382.82 | -44.32 | -342.27 | -420.66 | -405.57 |
| Nxy on x-face | Nxy on y-face | |||||||||
| FWD | UP | DOWN | INBD | OUTBD | FWD | UP | DOWN | INBD | OUTBD | |
| Max | 808.37 | 451.78 | 2,178.23 | 1,291.03 | 3,632.13 | 87.78 | 49.06 | 236.52 | 140.19 | 394.40 |
| Min | -1,245.42 | -1,364.60 | -721.16 | -3,632.14 | -1,291.03 | -135.23 | -148.18 | -78.31 | -394.40 | -140.19 |
| Qx on x-face | Qy on y-face | |||||||||
| FWD | UP | DOWN | INBD | OUTBD | FWD | UP | DOWN | INBD | OUTBD | |
| Max | 1,066.37 | 478.14 | 1,579.31 | 439.63 | 584.58 | 41.32 | 52.87 | 67.47 | 48.60 | 58.42 |
| Min | -637.32 | -989.39 | -763.22 | -584.58 | -439.63 | -41.87 | -42.27 | -84.40 | -58.42 | -48.60 |
Conservatively, we will assume that these maximum values are the same for all edges in this panel. As illustrated in Error! Reference source not found., the maximum tensile and shear values at the corner rivets are 62 lbf and 384.97 lbf, respectively. The rivet in this joint configuration has an ultimate tensile and shear strength values of ftu=285 lbf and fsu=428 lbf, respectively. Therefore, the rivet’s margin of safety against shear load can be expressed as below:
It is noteworthy that the rivets pass by observation against the tensile load.
Upper Support Angles
Upper Support Angles’ Z-Rivets
Two upper support angles are attached to the upper attachment bracket (at the FWD and AFT slides) through 4 x MS20470AD5 (BJ5) Rivets at each side. The figure below illustrates the CBUSH forces components for the forward load case. The table below lists the tensile and shear forces carried by each rivet for all load cases. The maximum values of these forces belong to the forward load case, and it occurs at elements 1854 and 1859.
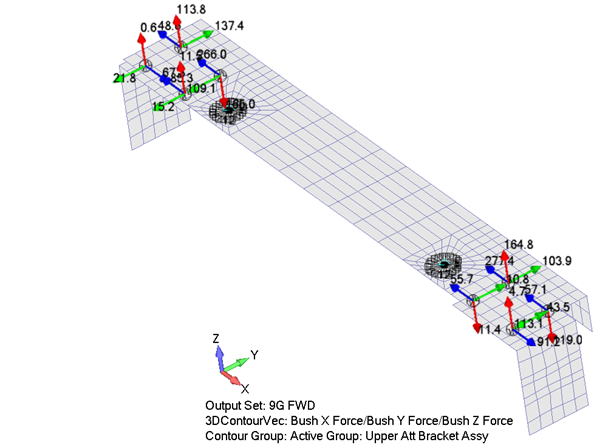
The Tensile and Shear Forces [lbf] Carried by each Rivet for All Load Cases. The highlighted cells are the Maximum Values.
| FWD | UP | DOWN | INBOARD | OUTBOARD | ||||||
|---|---|---|---|---|---|---|---|---|---|---|
| ID | Tensile | Shear | Tensile | Shear | Tensile | Shear | Tensile | Shear | Tensile | Shear |
| 1854 | 164.96 | 287.49 | -0.77 | 0.72 | 1.24 | 1.16 | -19.31 | 27.81 | 19.31 | 27.81 |
| 1855 | -113.82 | 145.76 | 2.66 | 5.05 | -4.25 | 8.07 | -6.35 | 60.48 | 6.35 | 60.48 |
| 1856 | -11.50 | 69.03 | -0.63 | 2.68 | 1.01 | 4.27 | 8.83 | 15.98 | -8.83 | 15.98 |
| 1857 | -0.62 | 88.05 | -0.17 | 0.48 | 0.27 | 0.76 | 13.71 | 48.66 | -13.71 | 48.66 |
| 1858 | 119.04 | 126.69 | 0.65 | 0.57 | -1.04 | 0.91 | -25.34 | 70.82 | 25.34 | 70.82 |
| 1859 | -164.76 | 296.23 | 0.15 | 1.29 | -0.24 | 2.05 | 23.00 | 66.51 | -23.00 | 66.51 |
| 1860 | 11.41 | 56.74 | 1.09 | 3.51 | -1.74 | 5.60 | -8.72 | 46.13 | 8.72 | 46.13 |
| 1861 | -4.72 | 101.05 | -0.13 | 0.27 | 0.20 | 0.42 | 14.17 | 70.13 | -14.17 | 70.13 |
As shown in the corresponding table, the maximum tensile and shear values are 165 lbf and 297 lbf, respectively. The rivet in this joint configuration has an ultimate tensile and shear strength values of ftu=758 lbf and fsu=596 lbf, respectively. Therefore, the rivet’s margin of safety against shear load can be expressed as below:
It is noteworthy that the rivets pass by observation against the tensile load.
Upper Support Angle’ X-Screws
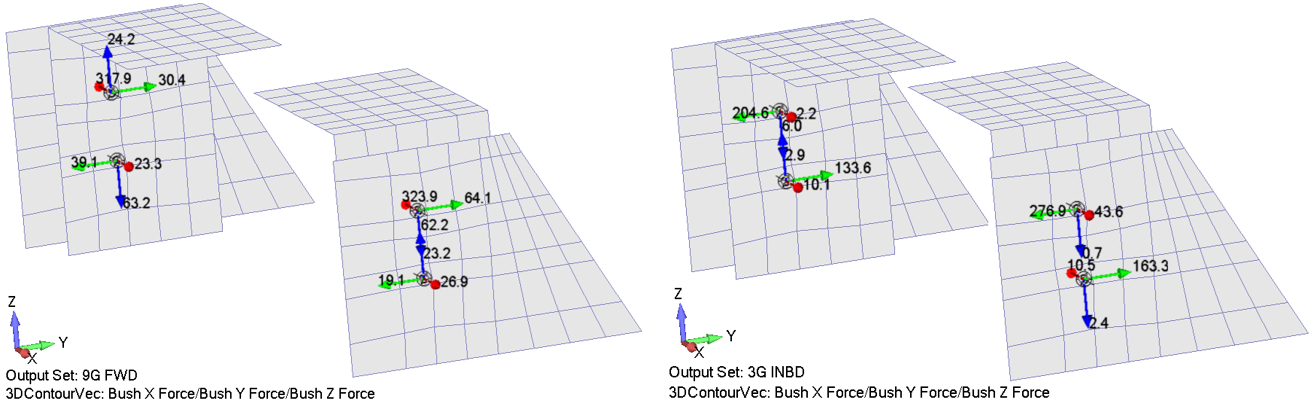
The Tensile and Shear Forces [lbf] Carried by each Screw for All Load Cases. The highlighted cells are the Maximum Values.
| FWD | UP | DOWN | INBOARD | OUTBOARD | ||||||
|---|---|---|---|---|---|---|---|---|---|---|
| ID | Tensile | Shear | Tensile | Shear | Tensile | Shear | Tensile | Shear | Tensile | Shear |
| 1353 | -23.29 | 74.29 | 0.87 | 3.12 | -1.39 | 4.98 | -10.08 | 133.72 | 10.08 | 133.72 |
| 1354 | 317.91 | 38.87 | -1.75 | 7.00 | 2.80 | 11.18 | -2.15 | 204.63 | 2.15 | 204.63 |
| 3170 | -323.86 | 68.14 | 4.41 | 1.22 | -7.04 | 1.94 | 43.60 | 276.87 | -43.60 | 276.87 |
| 3171 | 26.86 | 65.05 | 0.09 | 2.03 | -0.14 | 3.24 | -10.52 | 163.30 | 10.52 | 163.30 |
As shown in the corresponding table, the maximum tensile and shear values are 324 lbf and 277 lbf, respectively. The screw in this joint configuration has an ultimate tensile and shear strength values of ftu=2,975 lbf and fsu=1,496 lbf, respectively. Therefore, the screw’s margin of safety against shear load can be expressed as below:
It is noteworthy that the screw pass by observation against the tensile load.
Attachment Gussets
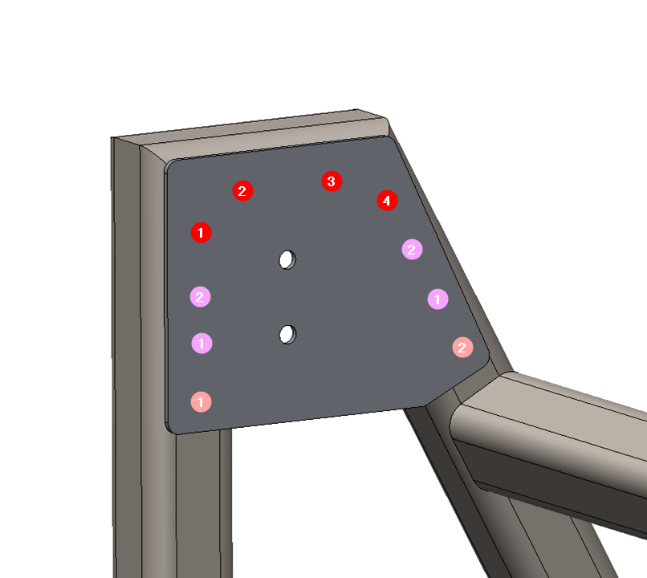
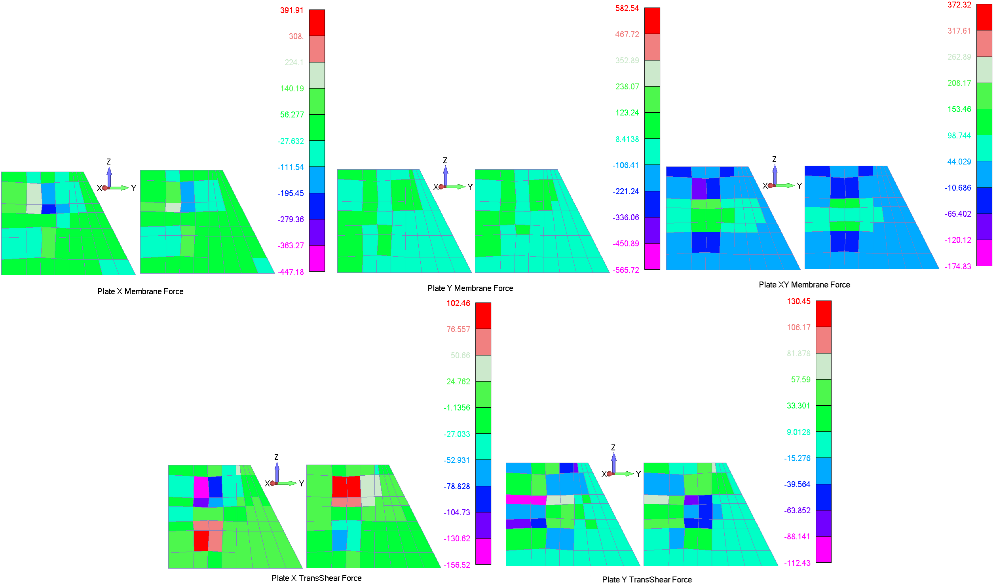
Conservatively, we will assume that these maximum values are the same for all edges in Attachment Gussets. As illustrated in , the maximum tensile and shear values at the corner rivets are 62 lbf and 384.97 lbf, respectively. The rivet in this joint configuration has an ultimate tensile and shear strength values of ftu=69.14 lbf and fsu=432.71 lbf, respectively. Therefore, the rivet’s margin of safety against shear and tensile loads can be expressed as below:
LED Dimmers’ Bracket and Shelf
As shown in the corresponding figure, the Dimmer Holder Brackets are fixed to the lower shelf through four MS27039-1-09 screws (two at the outboard side, and two at the inboard side). The LED Dimmers are attached to these holders through 4x MS27039-1-09 screws. Moreover, the lower shelf is fixed to the tube structure through 43x CR3213 (ARN4) Protruding Rivets.
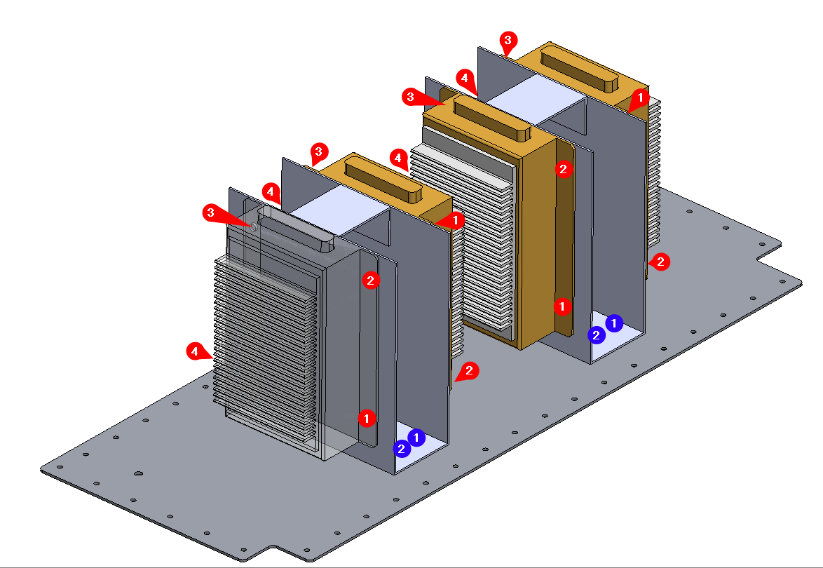
LED Dimmers’ Screws
The figure below illustrates the Dimmer Holder Brackets’ Forces, Shear Flows, Shear Forces per unit length. Moreover, The table below lists the maximum Membrane Forces, Shear Flows, and Shear Forces for all load cases. The maximum values of these forces belong to the forward load case, and it occurs at elements 2391, 2430, 3152, and 3280.
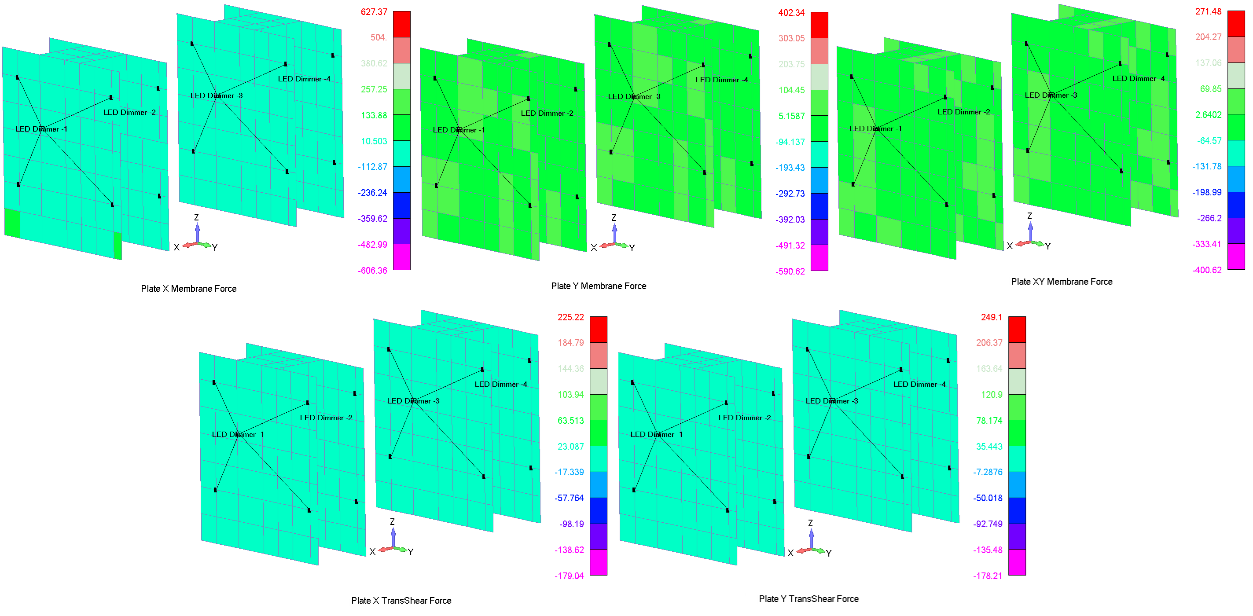
The Maximum Membrane Forces, Shear Flows, and Shear Forces [lbf] for all load cases, where the highlighted cells represent the maximum values.
| Nx on x-face | Ny on y-face | |||||||||
|---|---|---|---|---|---|---|---|---|---|---|
| FWD | UP | DOWN | INBD | OUTBD | FWD | UP | DOWN | INBD | OUTBD | |
| Max | 71.48 | 17.75 | 7.00 | 15.71 | 8.28 | 385.16 | 61.57 | 12.38 | 55.42 | 26.56 |
| Min | -90.10 | -4.38 | -28.34 | -8.28 | -15.71 | -227.24 | -7.75 | -98.28 | -26.56 | -55.42 |
| Nxy on x-face | Nxy on y-face | |||||||||
| FWD | UP | DOWN | INBD | OUTBD | FWD | UP | DOWN | INBD | OUTBD | |
| Max | 228.66 | 20.68 | 58.98 | 5.19 | 34.59 | 207.87 | 18.80 | 53.62 | 4.72 | 31.44 |
| Min | -96.60 | -36.95 | -33.01 | -34.59 | -5.19 | -87.82 | -33.59 | -30.01 | -31.44 | -4.72 |
| Qx on x-face | Qy on y-face | |||||||||
| FWD | UP | DOWN | INBD | OUTBD | FWD | UP | DOWN | INBD | OUTBD | |
| Max | 22.29 | 1.76 | 2.87 | 1.26 | 1.18 | 48.04 | 1.49 | 2.10 | 1.42 | 1.16 |
| Min | -16.71 | -1.80 | -2.80 | -1.18 | -1.26 | -14.02 | -1.32 | -2.37 | -1.16 | -1.42 |
Conservatively, we will assume that these maximum values are the same for all edges in Dimmer Holder Brackets. As illustrated in , the maximum tensile and shear values at the corner screws are 35 lbf and 341 lbf, respectively. The screw in this joint configuration has an ultimate tensile and shear strength values of ftu=2,500 lbf and fsu=1,012 lbf, respectively. Therefore, the screws pass by observation against the tensile and shear loads.
Dimmer Holder’s Screws
The figure below illustrates the Forces, Shear Flows, Shear Forces per unit length for the Bottom Side of the Dimmer Holder Brackets. Moreover, The table below lists the maximum Membrane Forces, Shear Flows, and Shear Forces for all load cases. The maximum values of these forces belong to the forward load case, and it occurs at elements 1705, 3235, 3253, 3255, and 3355.
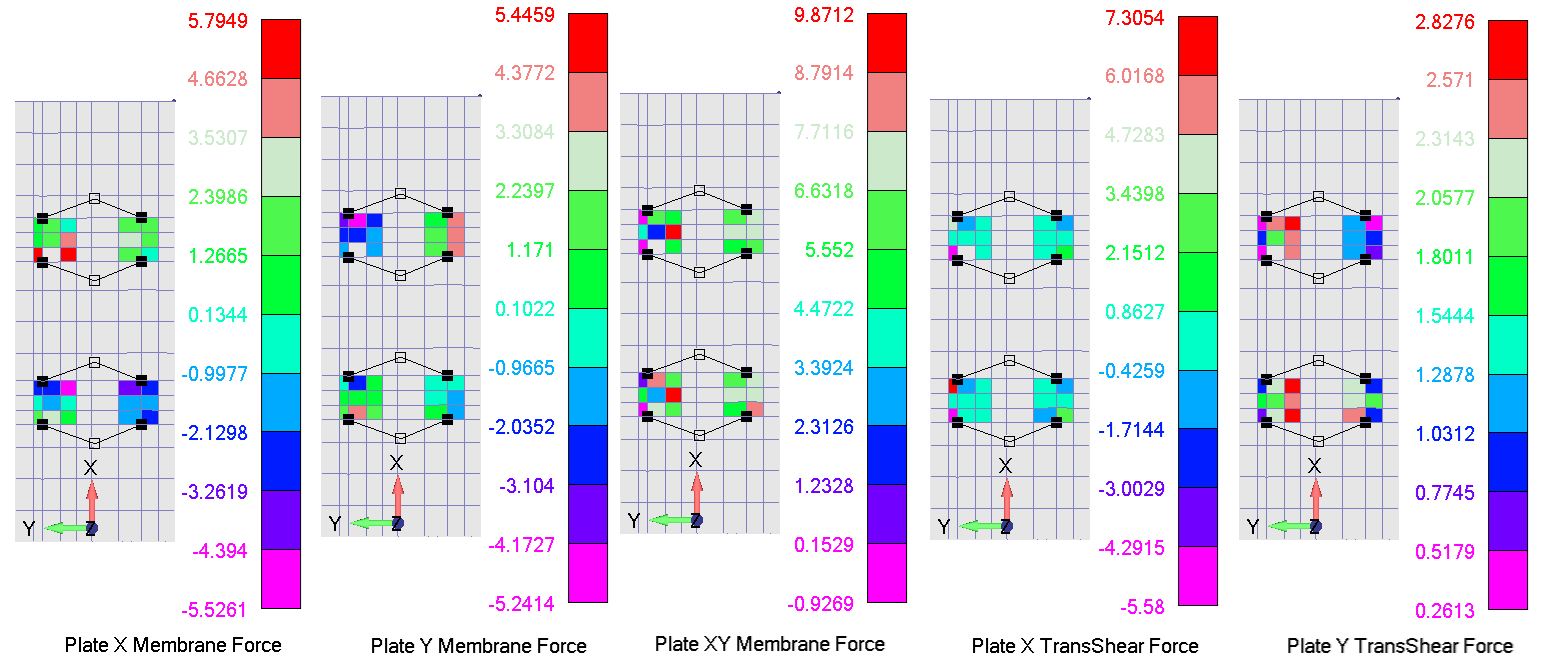
The Maximum Membrane Forces, Shear Flows, and Shear Forces [lbf] for all load cases, where the highlighted cells represent the maximum values.
| Nx on x-face | Ny on y-face | |||||||||
|---|---|---|---|---|---|---|---|---|---|---|
| FWD | UP | DOWN | INBD | OUTBD | FWD | UP | DOWN | INBD | OUTBD | |
| Max | 10.43 | -0.38 | 3.18 | 1.06 | 2.51 | 27.23 | -0.12 | 9.02 | 2.84 | 17.03 |
| Min | -9.95 | -1.99 | 0.61 | -2.51 | -1.06 | -26.21 | -5.65 | 0.20 | -17.03 | -2.84 |
| Nxy on x-face | Nxy on y-face | |||||||||
| FWD | UP | DOWN | INBD | OUTBD | FWD | UP | DOWN | INBD | OUTBD | |
| Max | 17.77 | 0.93 | 0.64 | 1.53 | 2.48 | 49.36 | 2.57 | 1.78 | 4.25 | 6.90 |
| Min | -1.67 | -0.40 | -1.48 | -2.48 | -1.53 | -4.63 | -1.11 | -4.11 | -6.90 | -4.25 |
| Qx on x-face | Qy on y-face | |||||||||
| FWD | UP | DOWN | INBD | OUTBD | FWD | UP | DOWN | INBD | OUTBD | |
| Max | 13.15 | 2.31 | 1.50 | 2.34 | 0.23 | 14.14 | 1.28 | 2.06 | 1.08 | 1.33 |
| Min | -10.04 | -0.94 | -3.69 | -0.23 | -2.34 | 1.31 | -1.29 | -2.04 | -1.33 | -1.08 |
Conservatively, we will assume that these maximum values are the same for all edges at the bottom side of the Dimmer Holder Brackets. As illustrated in , the maximum tensile and shear values at the corner screws are 13.64 lbf and 37.41 lbf, respectively. The screw in this joint configuration has an ultimate tensile and shear strength values of ftu=2,500 lbf and fsu=1,187 lbf, respectively. Therefore, the screws pass by observation against the tensile and shear loads.
Lower Shelf’s Rivets
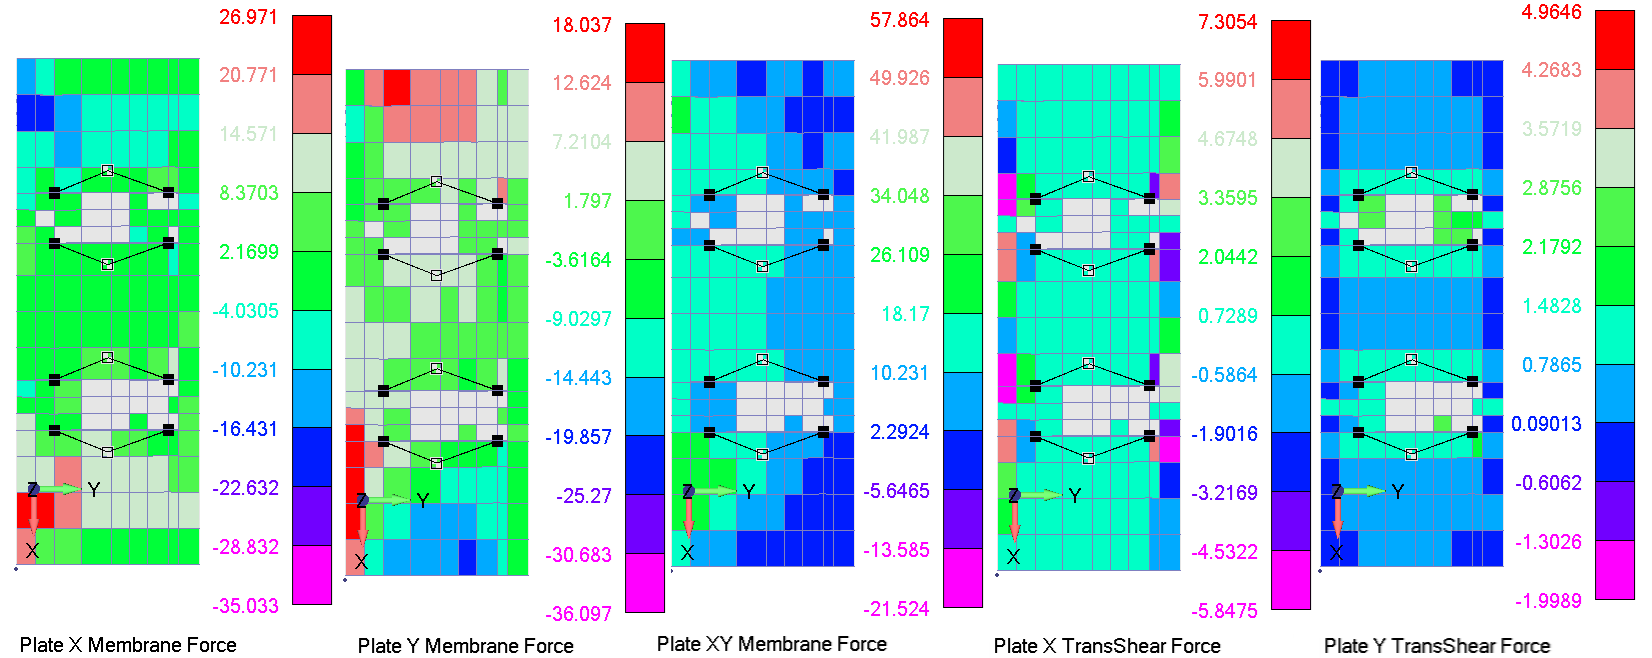
Table Supports
Table Supports – AFT Tower Skin Panel
The Two Table Supports are attached to the AFT Tower Skin Panel through 4x MS27039-1-09 Screws (two at each support). The figure below illustrates the CBUSH forces components for the forward and downward load cases. The table below lists the tensile and shear forces carried by each screw for all load cases. The maximum tensile and shear forces values belong to the forward and downward load cases, respectively, and it occurs at elements 2249 and 2332, respectively.
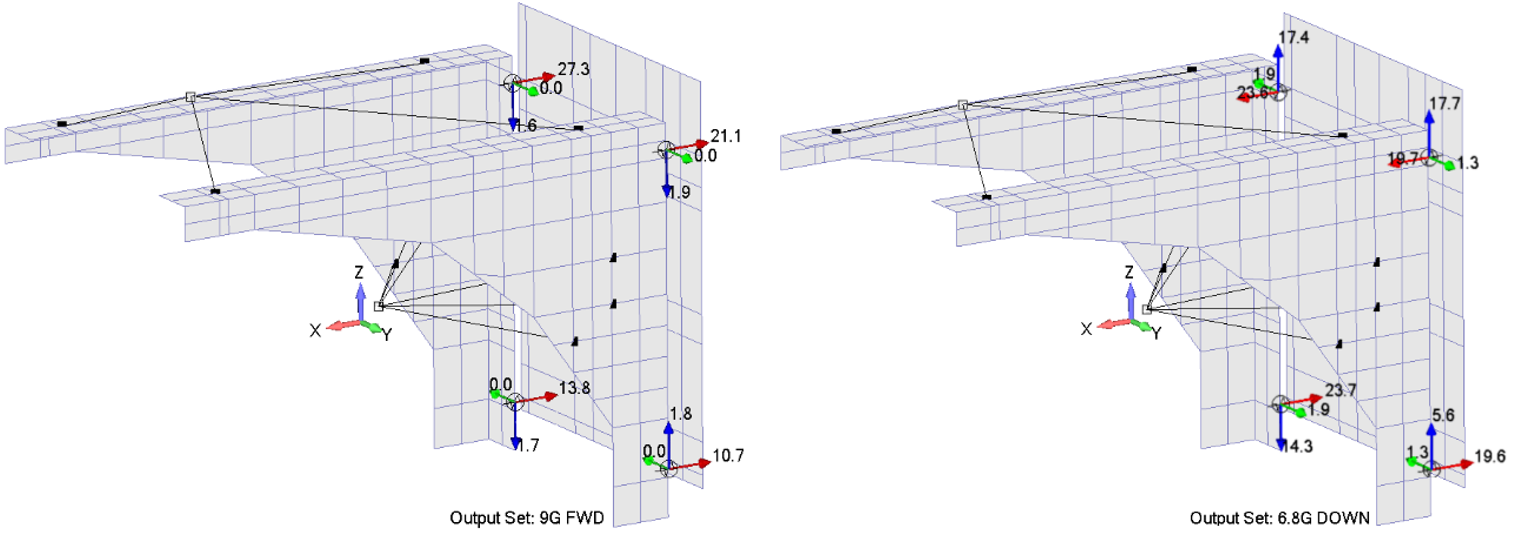
The Tensile and Shear Forces [lbf] Carried by each Screw for All Load Cases. The highlighted cells are the Maximum Values.
| FWD | UP | DOWN | INBOARD | OUTBOARD | ||||||
|---|---|---|---|---|---|---|---|---|---|---|
| ID | Tensile | Shear | Tensile | Shear | Tensile | Shear | Tensile | Shear | Tensile | Shear |
| 2249 | 27.33 | 1.59 | 14.80 | 10.98 | -23.62 | 17.52 | 4.79 | 8.72 | -4.79 | 8.72 |
| 2250 | -13.76 | 1.66 | 14.83 | 9.05 | -23.68 | 14.44 | -2.75 | 4.00 | 2.75 | 4.00 |
| 2331 | 10.71 | 1.79 | -12.30 | 3.63 | 19.63 | 5.79 | -2.76 | 3.70 | 2.76 | 3.70 |
| 2332 | 21.10 | 1.87 | 12.34 | 11.12 | -19.69 | 17.75 | -4.78 | 8.48 | 4.78 | 8.48 |
As shown in the corresponding table, the maximum tensile and shear values are 27.33 lbf and 17.75 lbf, respectively. The screw in this joint configuration has an ultimate tensile and shear strength values of ftu=2,500 lbf and fsu=1,187 lbf, respectively. Therefore, the screws pass by observation against the tensile and shear loads.
Table Supports – Composite Table
As shown in the corresponding figure, the Composite Table (TEKLAM AA207-66-1000) is fixed to the two Table Supports through 4x NAS1801-3-11 Screws (two at each support), that go through NAS1832-3-6 Blind Threaded Inserts.
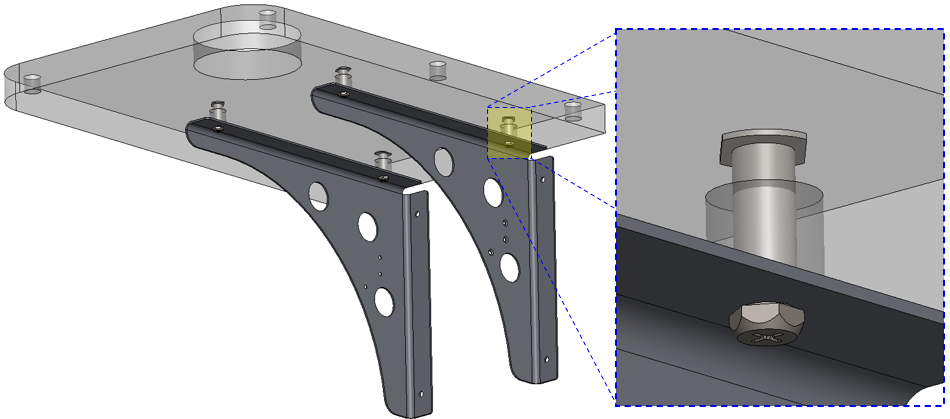
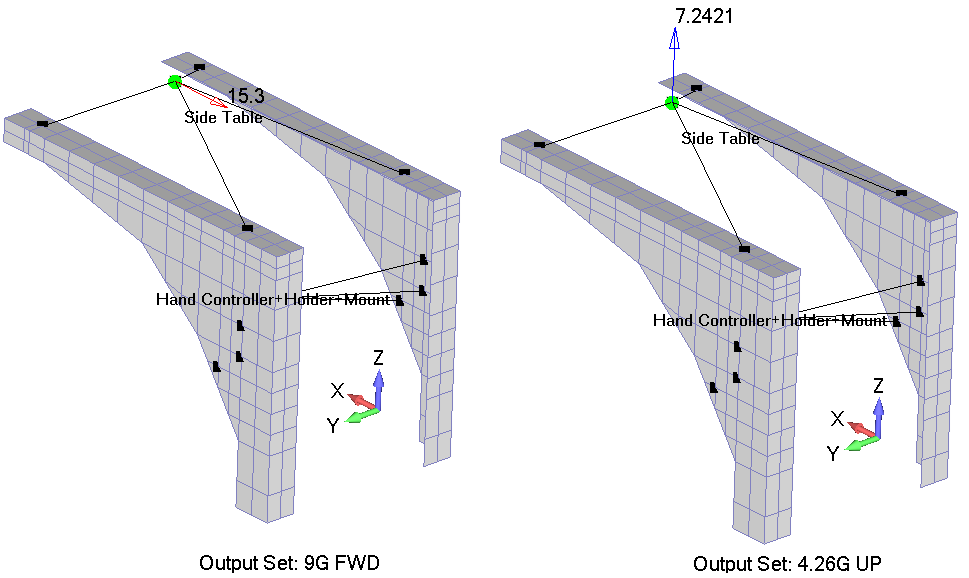
As shown in the corresponding figure, the maximum shear and tensile loads at the composite shelf occure at the forward and upward load cases, respectively. The NAS1801-3-11 Screws have an ultimate tensile and shear strength values of 2,975 lbf and 1,496 lbf, respectively. In addition, the NAS1832-3-6 Blind Threaded Inserts have an ultimate tensile and shear strength values of 1,122 lbf and 921 lbf, respectively. Hence, the Blind Threaded Inserts’ allowables will be the joint allowable. Assuming that the maximum loads are carried by the NAS1832-3-6 Blind Threaded Inserts only, these insert pass by observation. Moreover, the NAS1801-3-11 Screws pass by comparison.
Table Supports – Hand Controller
As shown in the corresponding figure, the Hand Controller, its Holder, and its Mount are fixed to the two Table Supports through 6x MS20426AD4 (BB4) rivets (three at each support). The maximum shear and tensile loads due to this assymbly occure at the forward and inboard load cases, respectively. Assuming that the maximum loads are carried by the MS20426AD4 (BB4) rivets only, these rivets pass by observation.
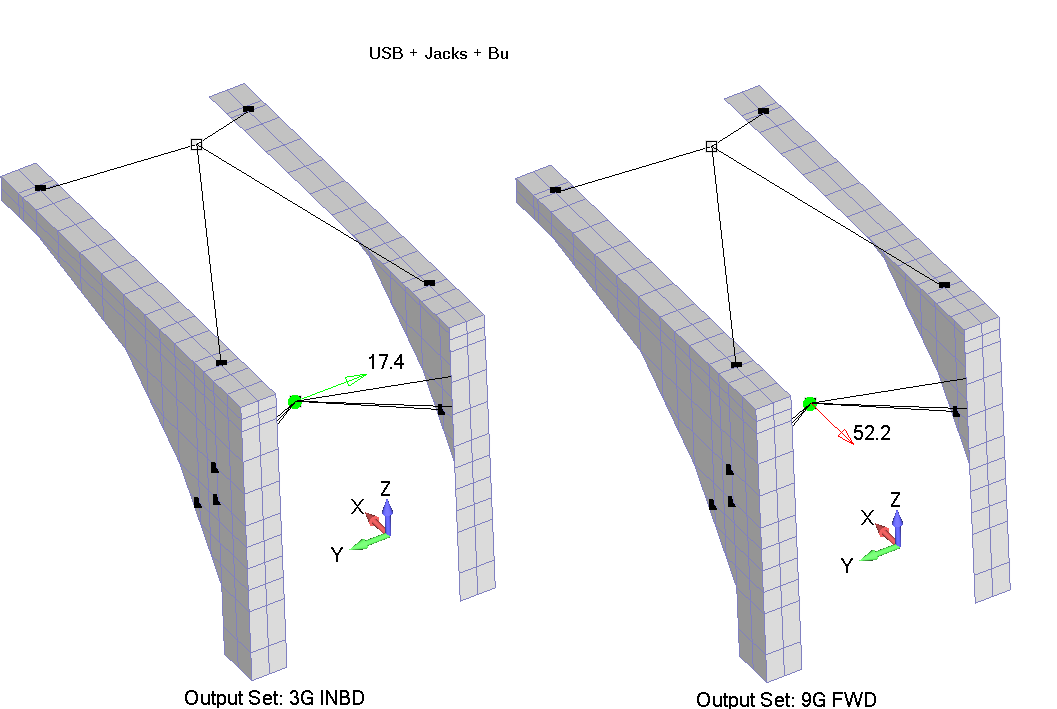
DZUS Rail Rivets
As shown in the corresponding figure, the DZUS Rail Components are fixed to the tube structure through 20xCR3213 (ARN4) rivets (ten at each support). The maximum shear and tensile loads due to this assymbly occure at the forward and inboard load cases, respectively. Assuming that the maximum loads are carried by the CR3213 (ARN4) rivets only, these rivets pass by observation.
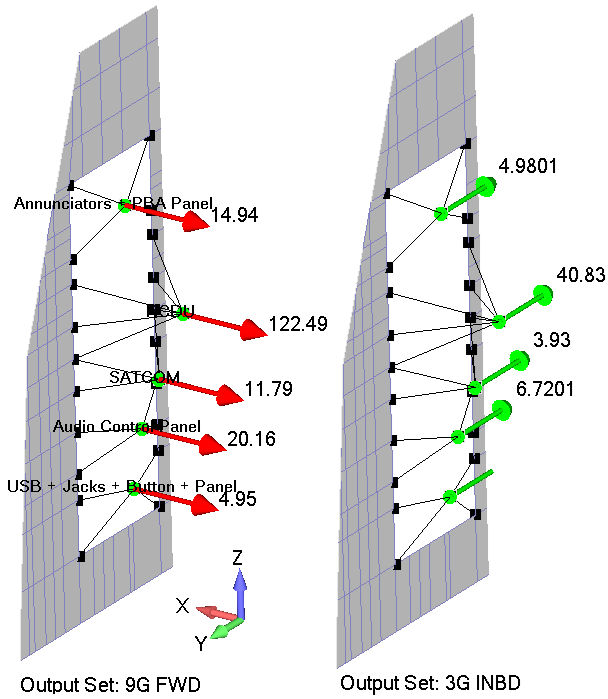
Desk-Tower Attachment ’s Screws
As shown in the corresponding figure, the Desk-Tower Attachment is done via
Three AN3-5A bolts that pass through the Desk Attachment Angle, Desk Attachment Brace, and Desk Tube structure
Twelve CR3213 (ARN4) rivets that pass through the Desk Attachment Angle and the Tower Tube Structure.
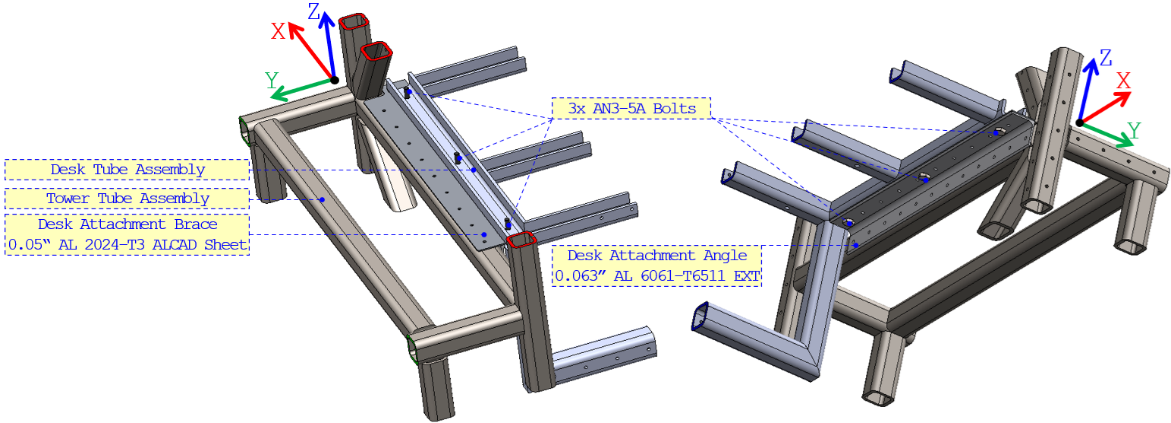
AN3-5A Bolts
The figure below illustrates the CBUSH forces components, carried by the AN3-5A Bolts, for the forward load case. The table below lists the tensile and shear forces carried by each screw for all load cases. The maximum tensile and shear forces values belong to the forward load case, and it occurs at elements 176 and 182, respectively.
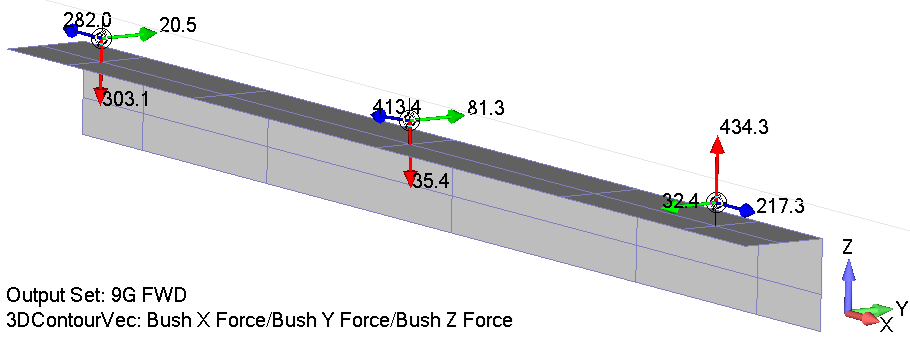
The Tensile and Shear Forces [lbf] Carried by each Screw for All Load Cases. The highlighted cells are the Maximum Values.
| FWD | UP | DOWN | INBOARD | OUTBOARD | ||||||
|---|---|---|---|---|---|---|---|---|---|---|
| ID | Tensile | Shear | Tensile | Shear | Tensile | Shear | Tensile | Shear | Tensile | Shear |
| 175 | 282.03 | 303.84 | 39.19 | 93.12 | -62.56 | 148.64 | 69.71 | 272.48 | -69.71 | 272.47 |
| 176 | 413.45 | 88.73 | 37.25 | 28.49 | -59.45 | 45.48 | 9.37 | 34.75 | -9.37 | 34.75 |
| 182 | -217.29 | 435.53 | -70.65 | 89.41 | 112.78 | 142.72 | -78.60 | 154.25 | 78.60 | 154.25 |
As shown in the corresponding table, the maximum tensile and shear values are 413.45 lbf and 435.53 lbf, respectively. The bolt in this joint configuration has an ultimate tensile and shear strength values of ftu=2,210 lbf and fsu=1,187 lbf, respectively. Therefore, the bolts pass by observation against the tensile and shear loads.
CR3213 Rivets
The figure below illustrates the Membrane Forces, Shear Flows, Shear Forces per unit length of the riveted part of the Desk Attachment Angle.
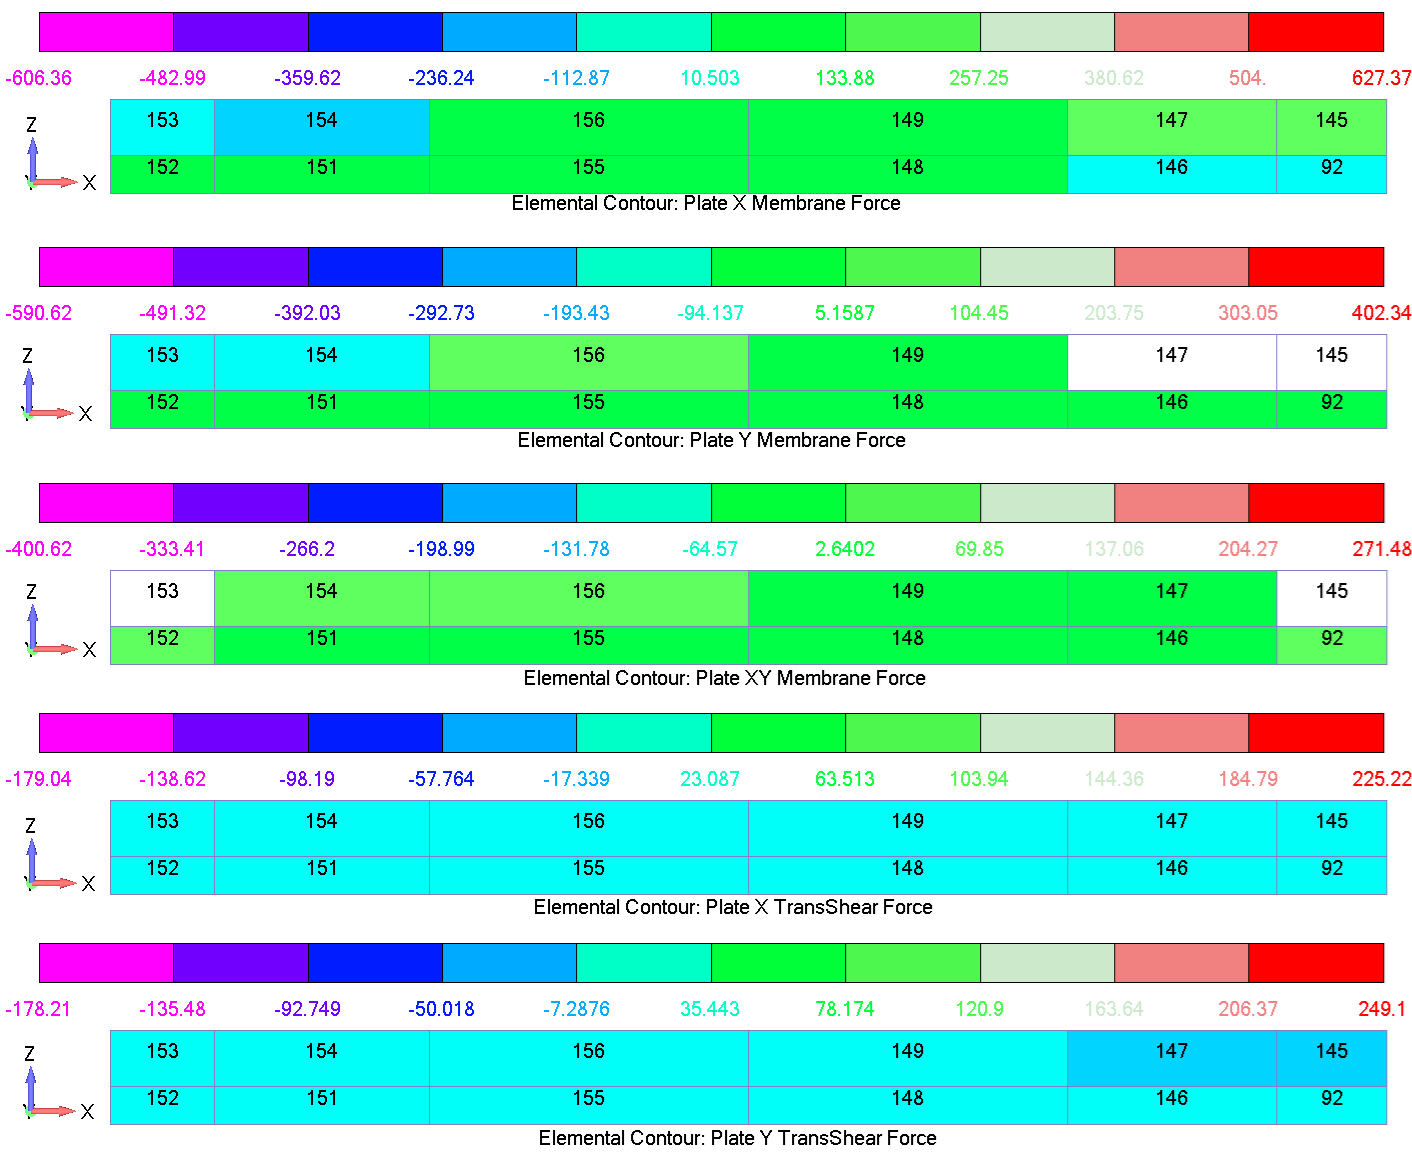
The plate-force post-processing was automated to reduce repetitive manual work and improve traceability. The script reads FEMAP-exported element and nodal data, rejects triangular elements, calculates element dimensions, converts membrane resultants to elemental forces, screens all load cases, and writes governing results to a summary workbook.
- Read the FEMAP Excel export and nodal coordinates.
- Extract nodal-coordinate values (X-Def, Y-Def, Z-Def).
- Filter valid quadrilateral plate elements.
- Calculate element dimensions and local force directions.
- Recover nx, ny, nxy, qx, and qy for every element and load case.
- Calculate elemental shear and tensile demand.
A conservative in-plane resultant is calculated as:
- Generate contour maps and a governing-result summary.
- 2D plot of elements and nodes.
- Heat maps for maximum shear load and maximum tensile load for every load case.
- Extract maximum membrane forces, shear, and tensile loads from each load case and save them to a new summary table.
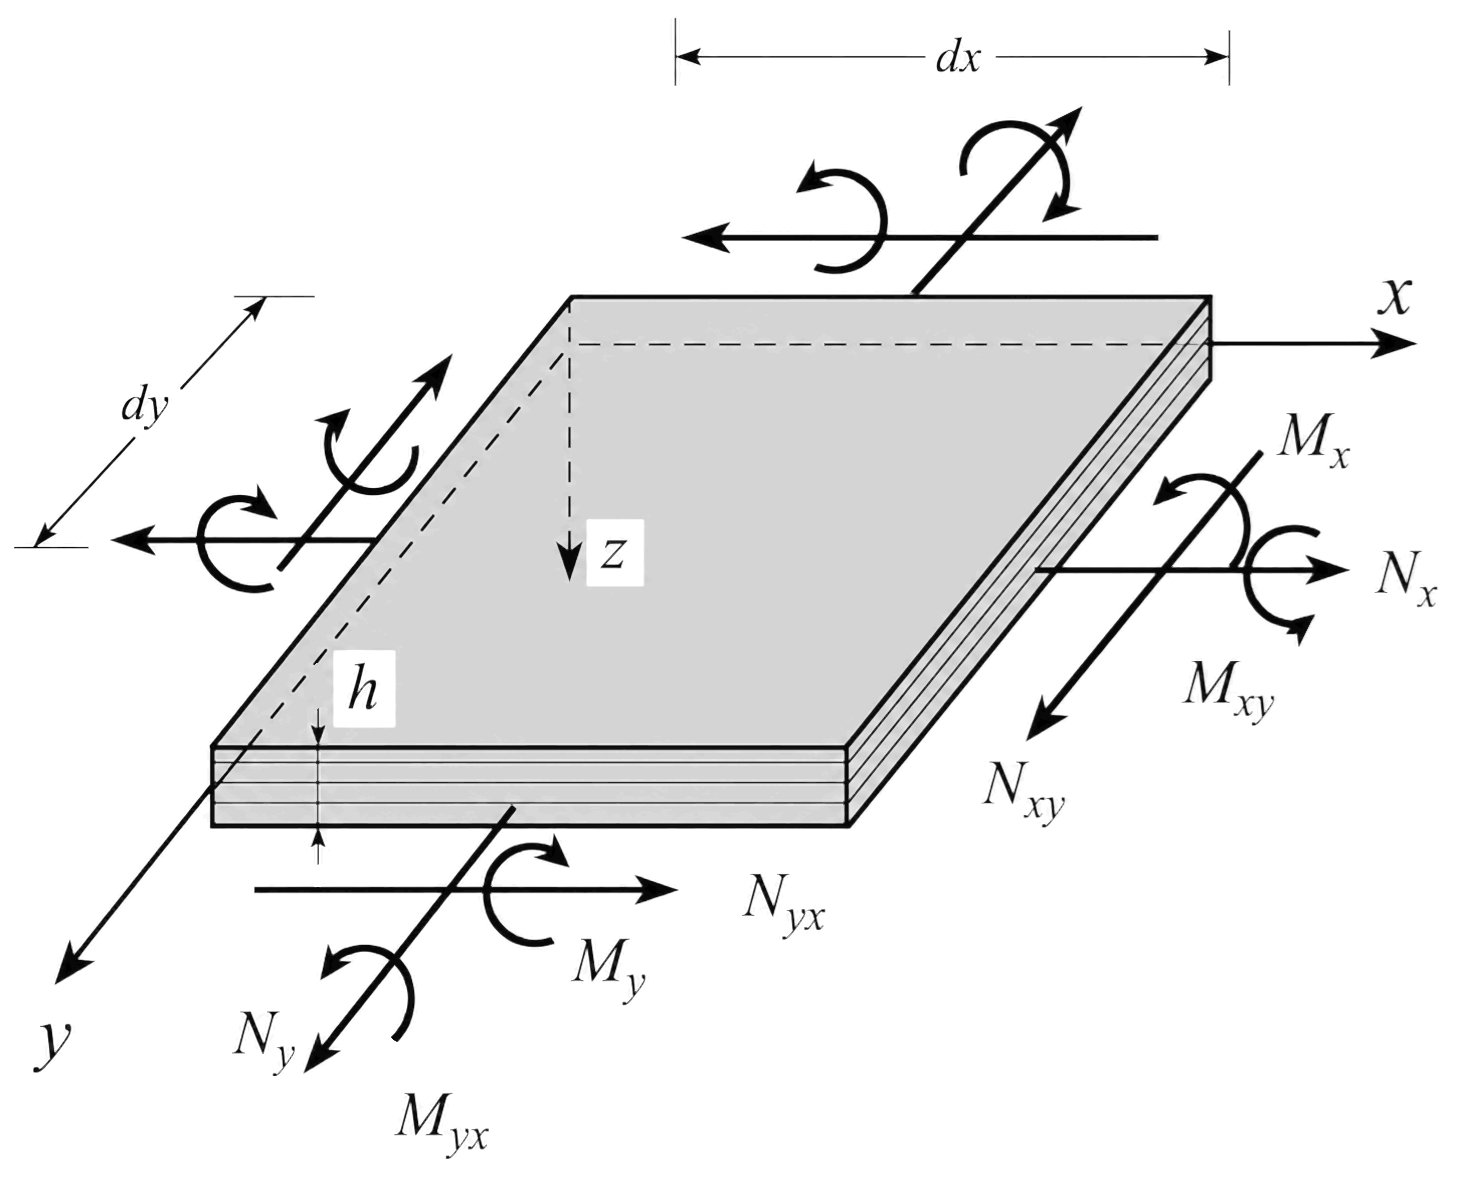
The Maximum Shear (xz-plane) and Tensile (out of plane) forces were calculated for each element in all load cases using python code. This code reads element and nodal data from an Excel file containing FEMAP results, and it extracts nodal coordinates. After that nodes are plotted with blue markers, elements are connected with thin grey lines, and element IDs are labeled (the corresponding figure). The elements dimensions are calculated using the nodal coordinates, and the Maximum Shear and Tensile forces are calculated based on these dimensions. The table below lists the Maximum Plate, Shear, and Tensile Forces for all load cases. The following figures show heat maps of the shear and tensile forces, respectively, for all elements in all load cases.
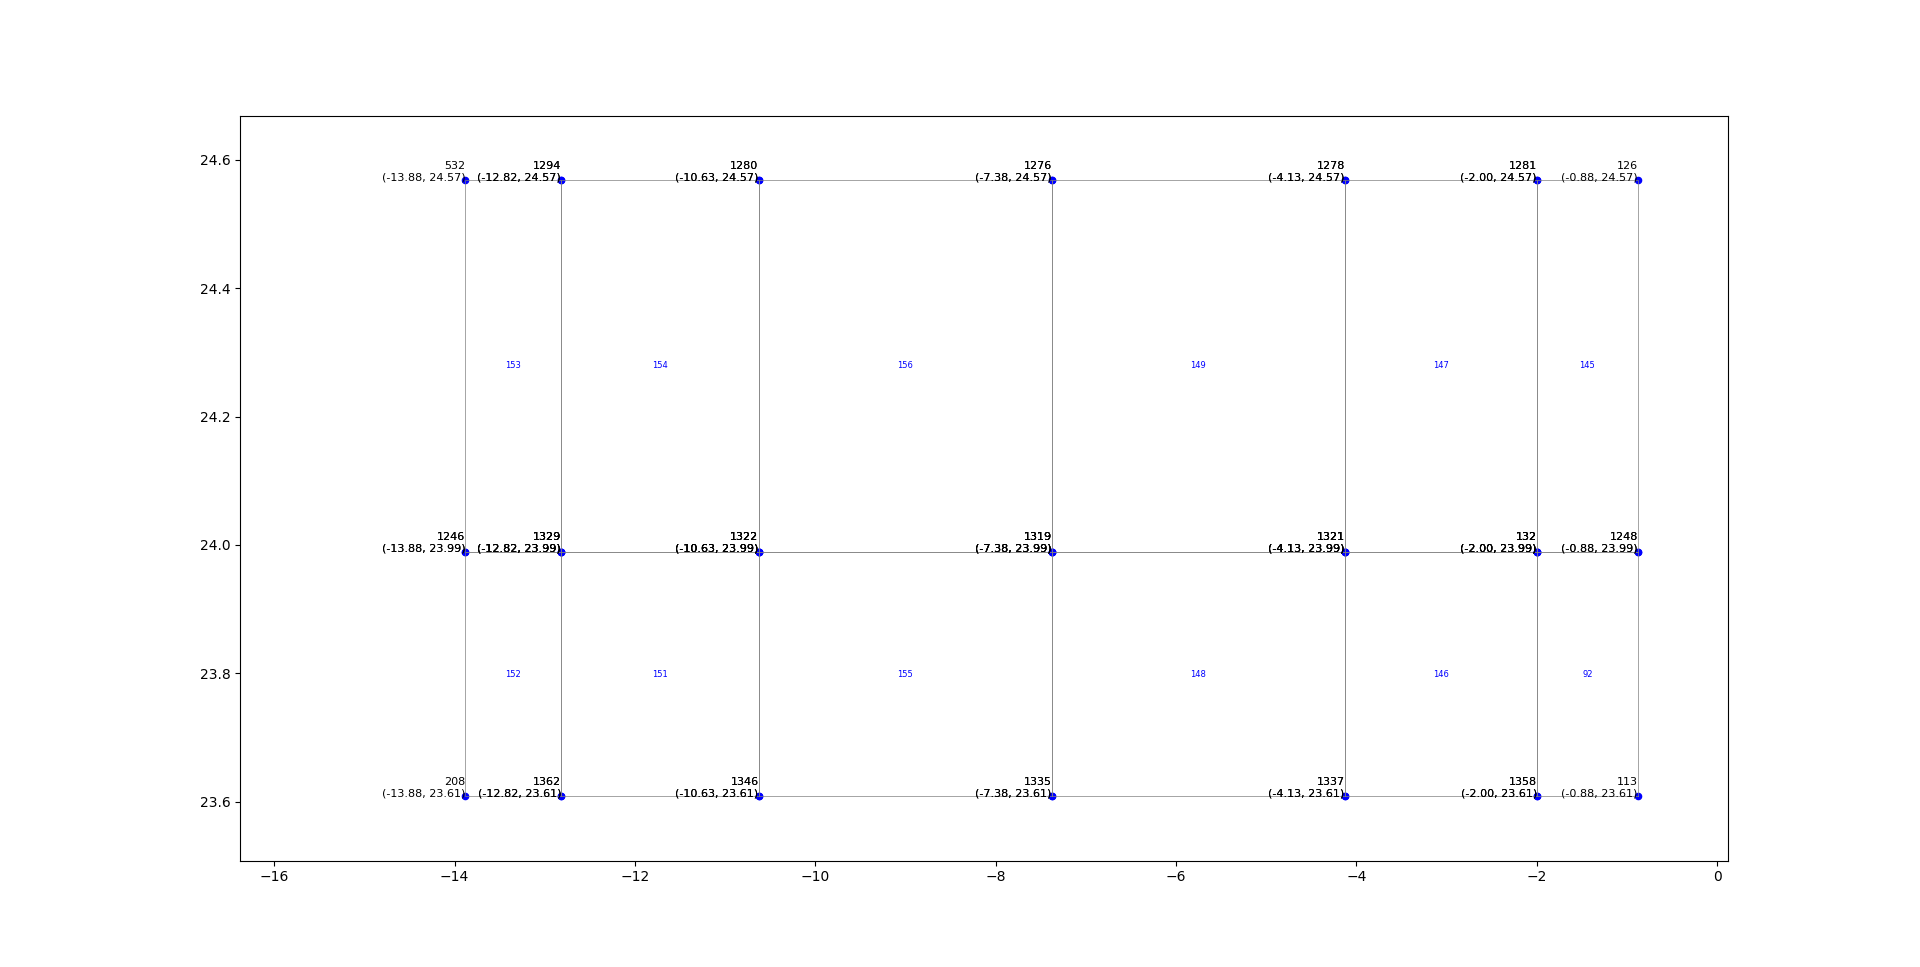
The Maximum Plate, Shear, and Tensile Forces [lbf] for all load cases, where the highlighted cells represent the maximum values.
| Load Case | ||||||||
|---|---|---|---|---|---|---|---|---|
| FWD | 114.06 | 392.55 | 71.96 | 165.39 | 0.09 | 69.37 | 389.93 | 69.37 |
| INBD | 47.64 | 219.59 | 9.57 | 45.27 | 0.28 | 28.88 | 240.41 | 28.89 |
| OUTBD | 15.28 | 63.08 | 29.25 | 53.54 | 0.13 | 71.40 | 240.40 | 71.42 |
| UP | 15.44 | 69.63 | 4.43 | 16.75 | 0.08 | 9.34 | 78.63 | 9.34 |
| DOWN | 6.64 | 7.21 | 12.68 | 30.26 | 0.15 | 28.67 | 125.52 | 28.66 |
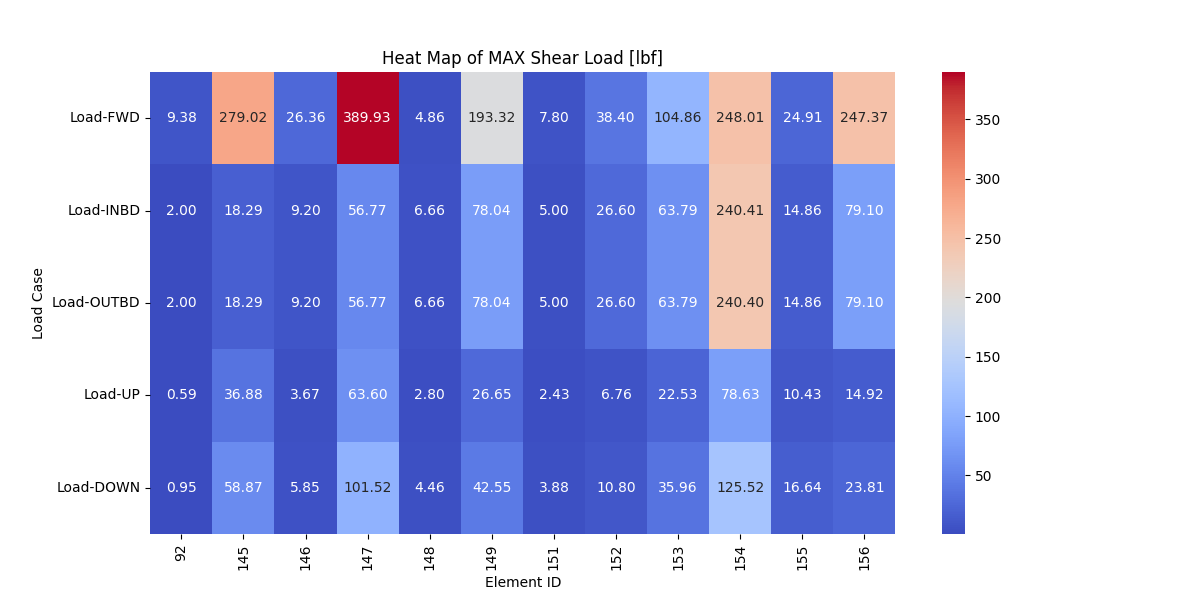
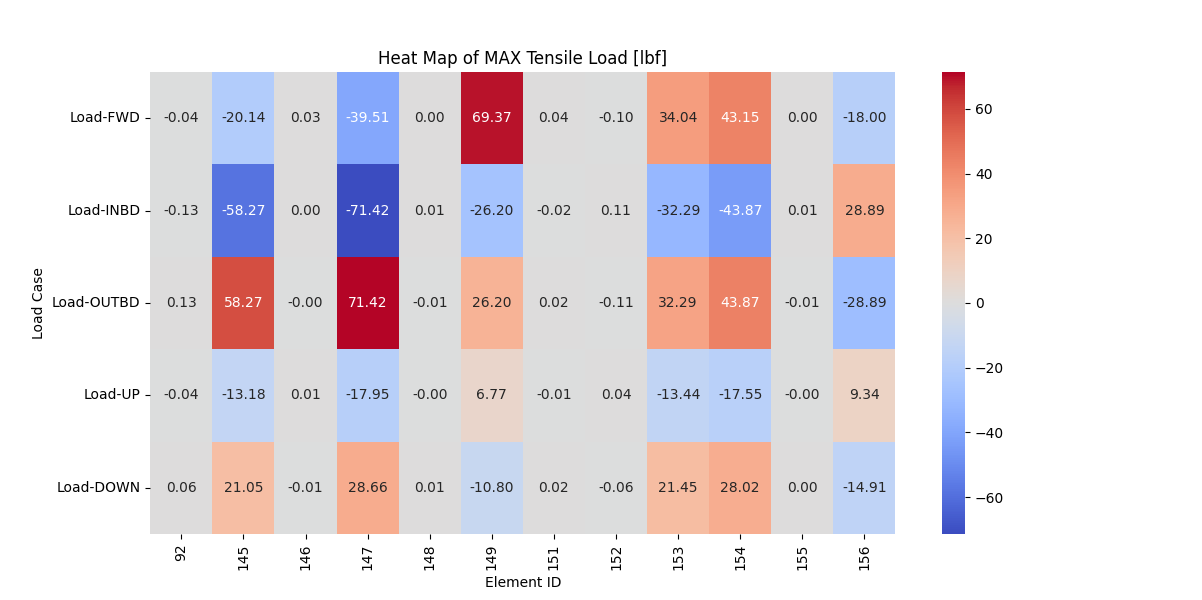
As illustrated previously, the maximum tensile and shear values are 71.42 lbf and 389.93 lbf, respectively, and these belong inboard and forward load cases, respectively, and it occurs at element 147. As shown in the corresponding figure, this load will be carried by two rivets. The rivet in this joint configuration has an ultimate tensile and shear strength values of ftu=115 lbf and fsu=316 lbf, respectively. Therefore, the rivet’s margin of safety against shear and tensile loads can be expressed as below:

Keyboard and Trackball
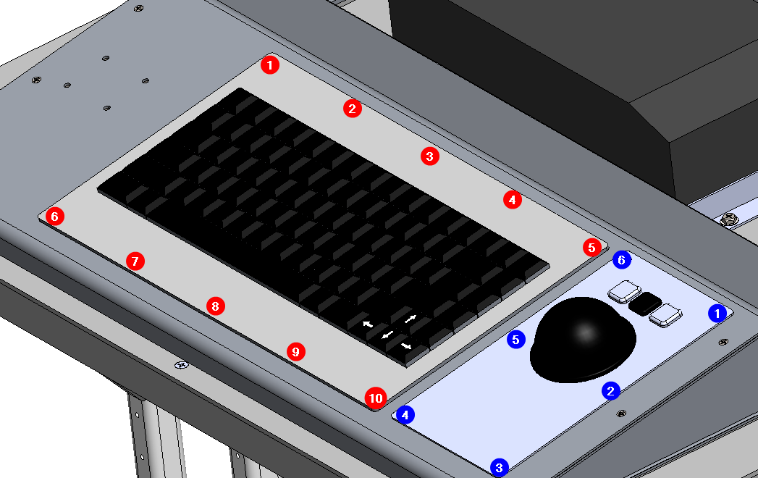
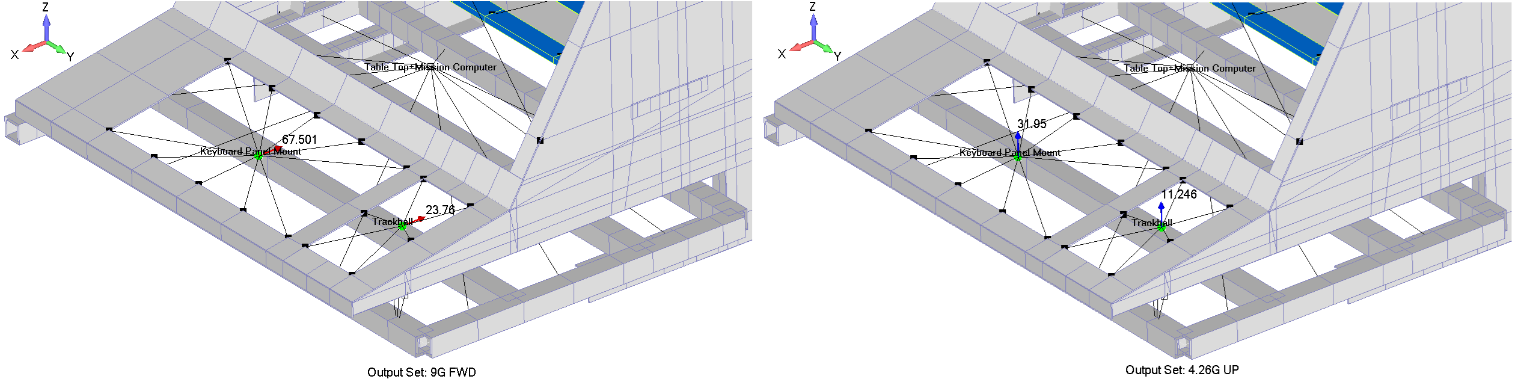
As shown in the corresponding figure, the maximum shear and tensile loads due to the keybpard and trackball occure at the forward and upward load cases, respectively. The MS24693-S28 Screws have an ultimate tensile and shear strength values of 545 lbf and 493 lbf, respectively. In addition, the MS24693-S50 Screws have an ultimate tensile and shear strength values of 840 lbf and 696 lbf, respectively. Assuming the entire tensile and shear loads caused by the Keyboard and Trackball are being carried by only their mounting screws, these screws pass by observation.
Keyboard Tray
As shown in the corresponding figure, the Keyboard Tray is fixed to the monitor brackets through 10x NAS8602-2 Screws (five at inboard and outboard sides). In order to assess these screws, the tray was divided into three parts, and the plate’s forces were analysed separately using the using python code. The figure below illustrates the Membrane Forces, Shear Flows, Shear Forces per unit length of the keyboard tray.
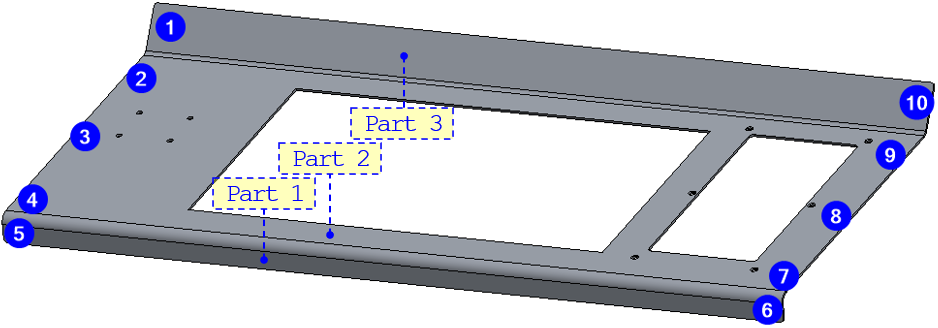
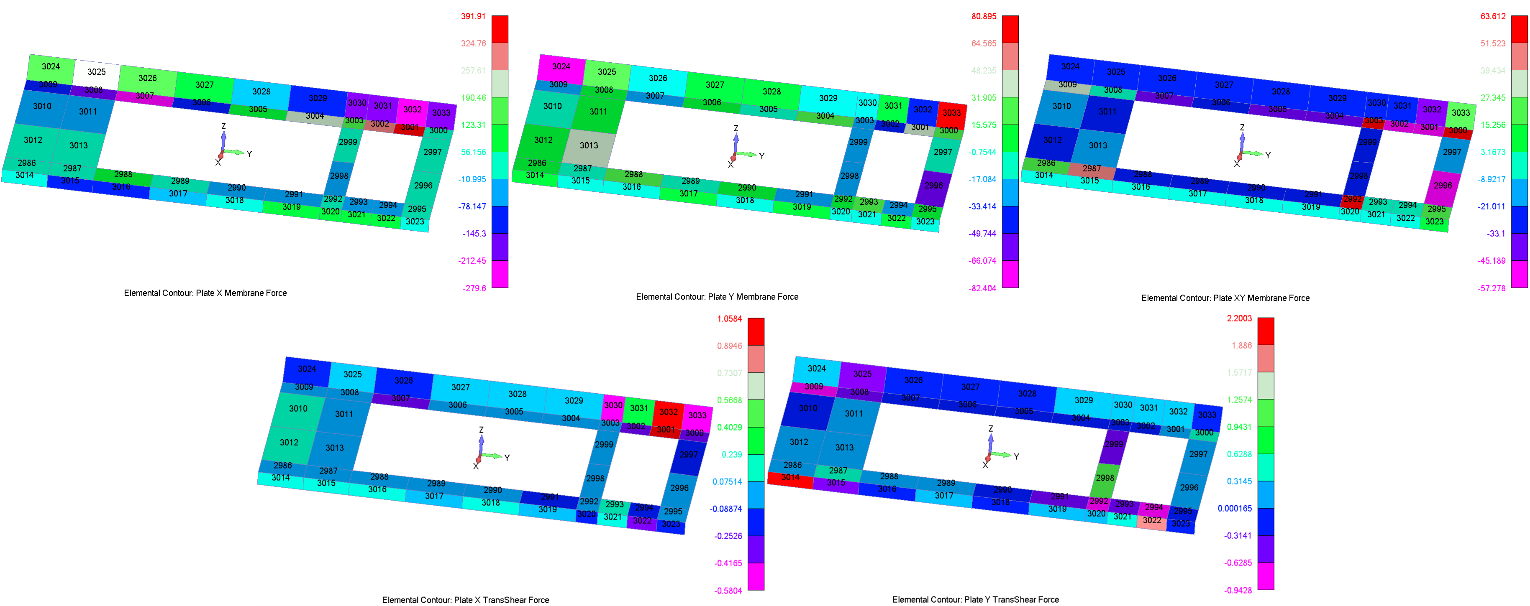
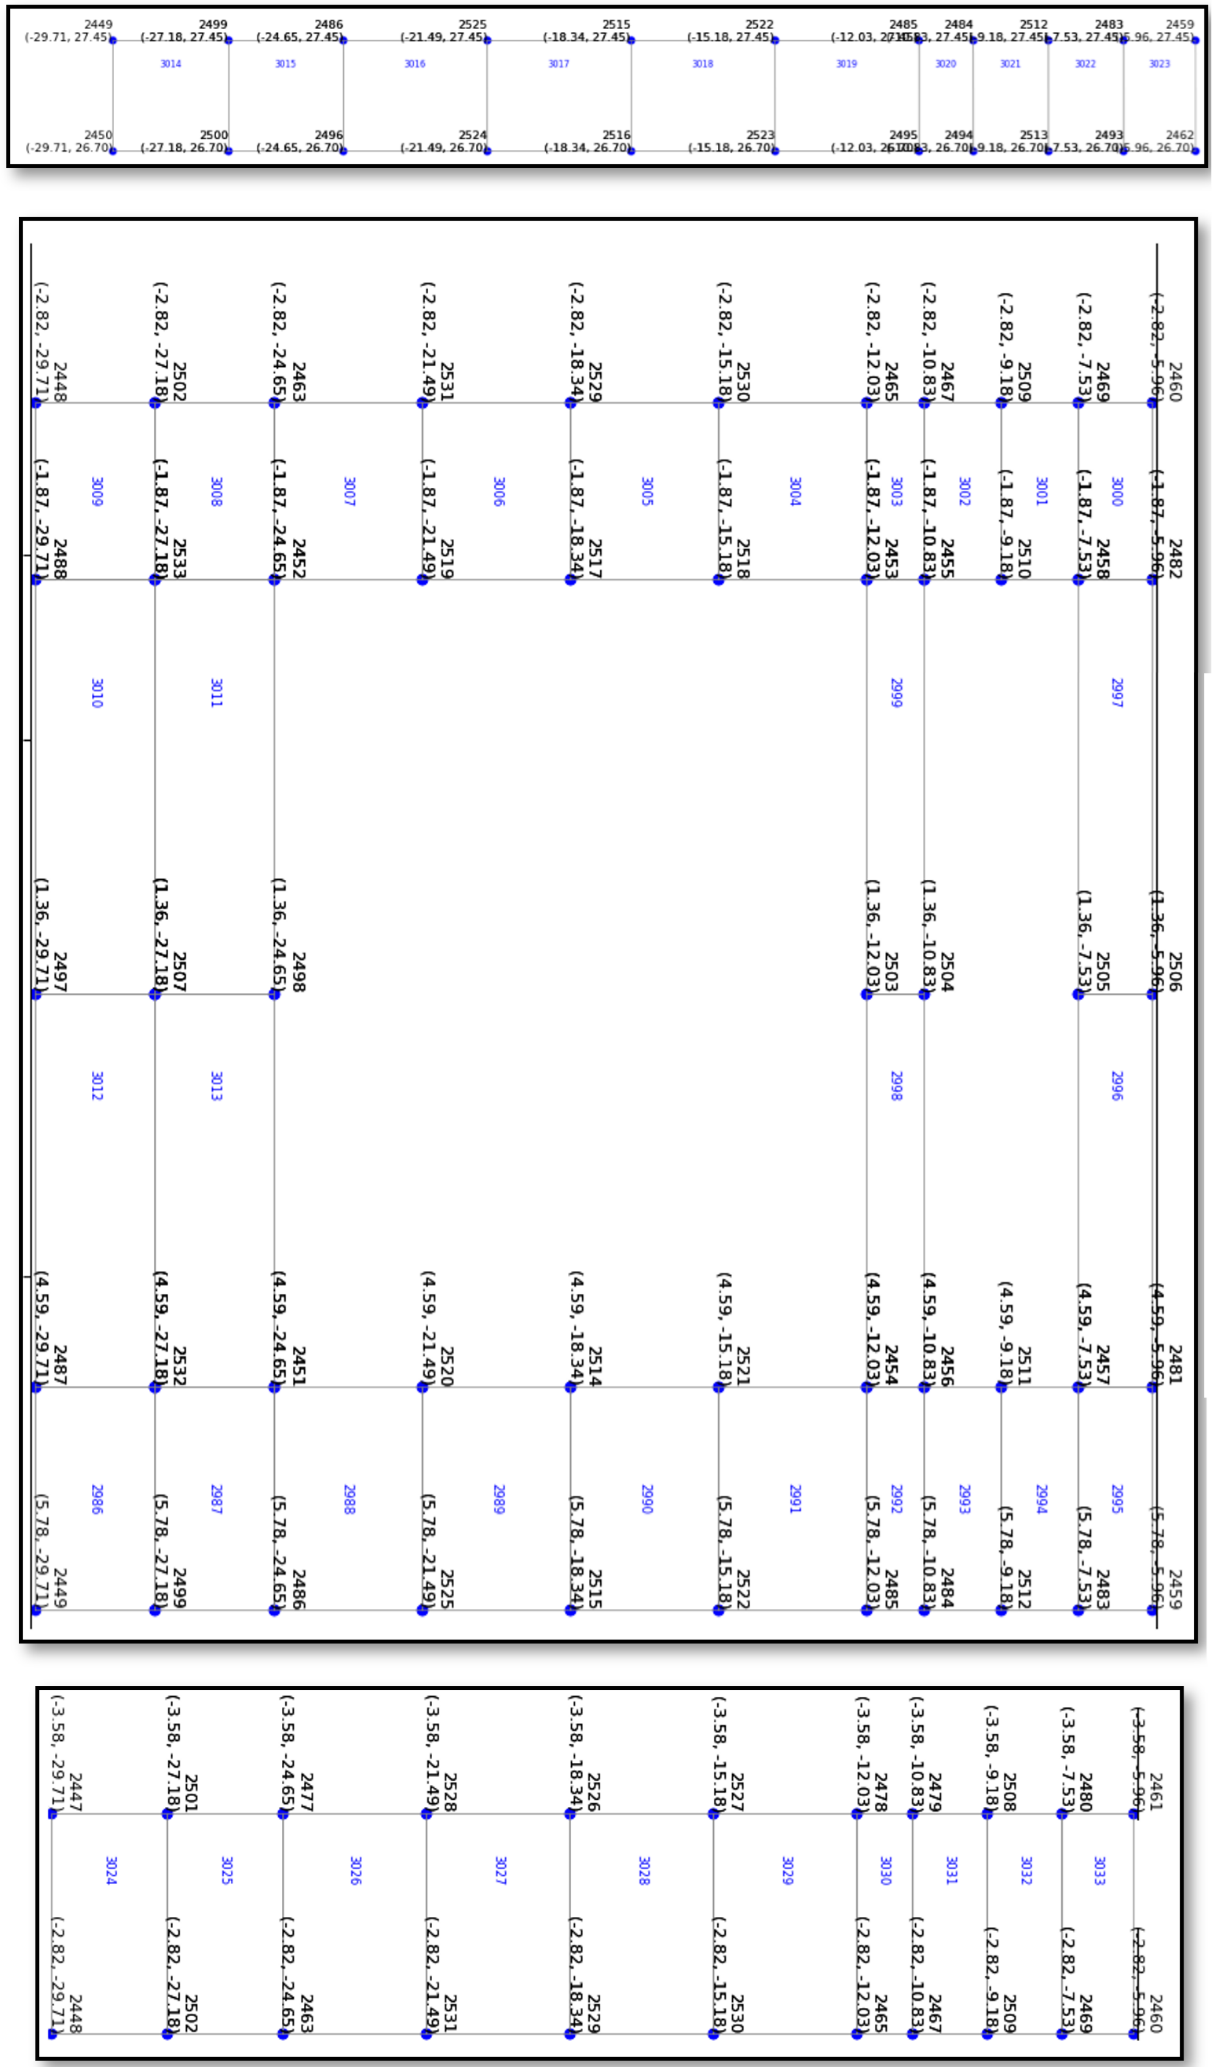
The Maximum Plate, Shear, and Tensile Forces [lbf] for all load cases, where the highlighted cells represent the maximum values.
| Part No | Load Case | ||||||||
|---|---|---|---|---|---|---|---|---|---|
| Part 1 | FWD | 56.95 | 7.99 | 6.97 | 17.29 | 0.14 | 1.73 | 52.32 | 1.71 |
| INBD | 23.60 | 5.99 | 8.92 | 30.07 | 0.23 | 2.04 | 48.00 | 2.22 | |
| OUTBD | 46.45 | 22.64 | 13.70 | 30.09 | 0.61 | 1.52 | 76.62 | 1.50 | |
| UP | 86.59 | 15.21 | 10.16 | 21.17 | 0.16 | 5.57 | 114.27 | 5.65 | |
| DOWN | 94.20 | 25.63 | 4.82 | 20.24 | 0.29 | 1.55 | 114.27 | 1.49 | |
| Part 2 | FWD | 119.64 | 190.43 | 73.36 | 70.14 | 0.66 | 3.01 | 240.56 | 3.11 |
| INBD | 72.74 | 45.74 | 12.63 | 25.81 | 1.43 | 2.57 | 68.58 | 2.48 | |
| OUTBD | 70.31 | 36.20 | 40.60 | 51.21 | 2.41 | 5.59 | 109.47 | 5.68 | |
| UP | 372.88 | 94.60 | 75.55 | 103.83 | 1.01 | 1.27 | 367.91 | 1.28 | |
| DOWN | 250.80 | 83.36 | 153.03 | 106.84 | 0.51 | 2.39 | 367.91 | 2.36 | |
| Part 3 | FWD | 201.16 | 89.55 | 14.90 | 4.74 | 0.30 | -0.06 | 205.32 | 0.13 |
| INBD | 85.64 | 25.26 | 29.08 | 8.70 | 0.97 | 0.16 | 83.84 | 0.86 | |
| OUTBD | 4.85 | 8.27 | 28.13 | 13.62 | 1.01 | 0.68 | 133.84 | 1.54 | |
| UP | 567.37 | 61.28 | 38.65 | 18.71 | 1.49 | 0.15 | 553.22 | 1.61 | |
| DOWN | 461.34 | 62.42 | 96.13 | 25.20 | 0.91 | 0.30 | 553.22 | 1.13 |
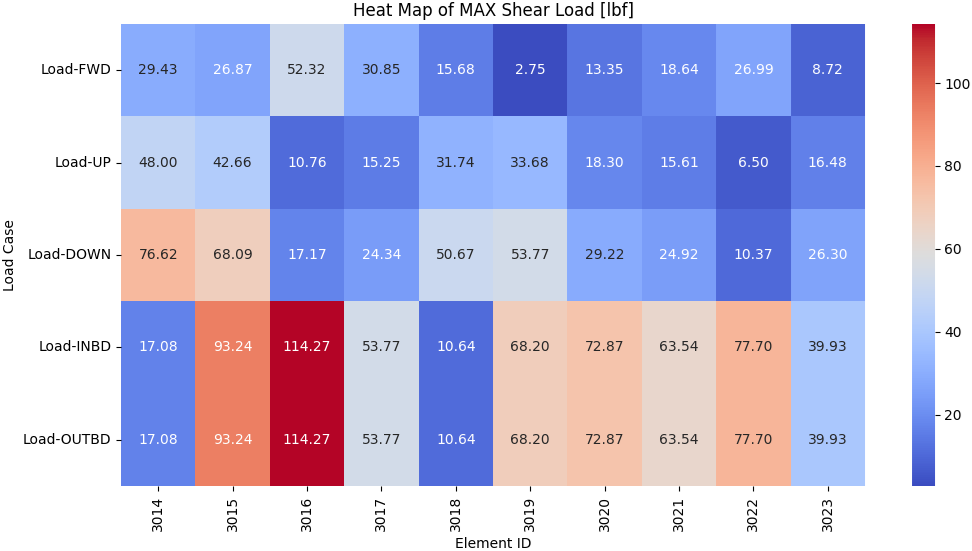
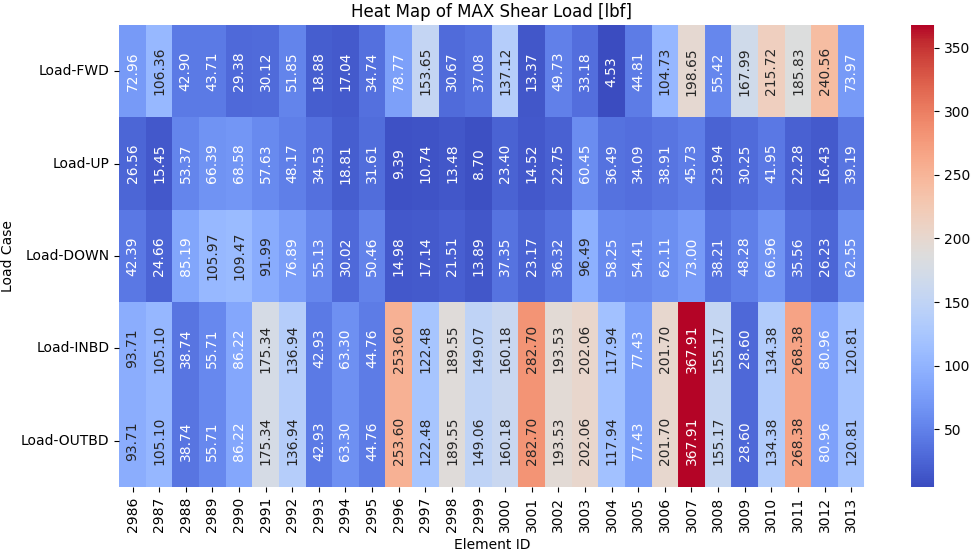
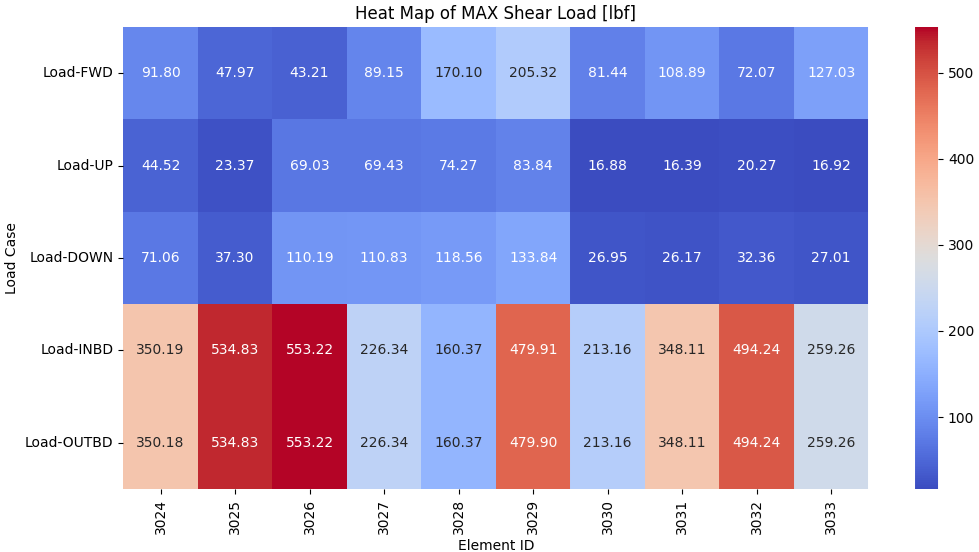
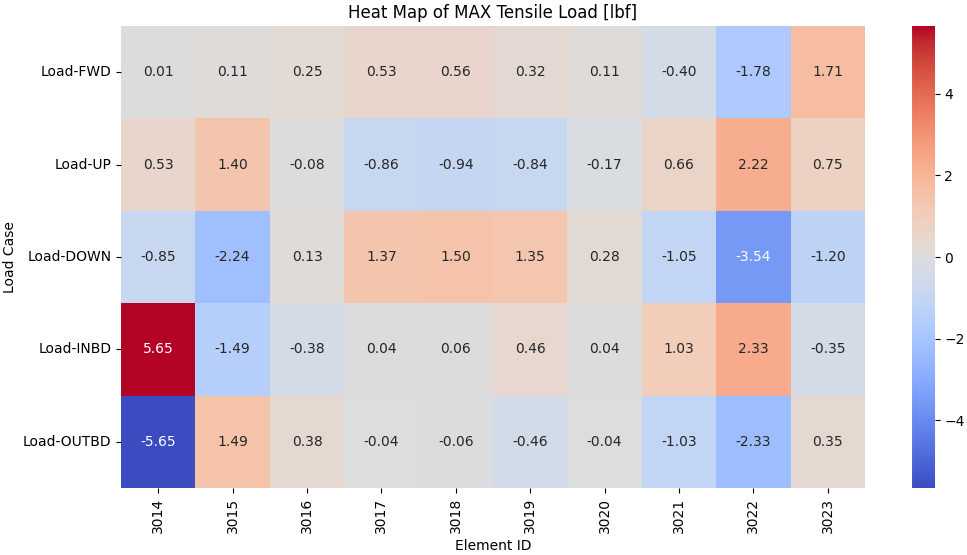
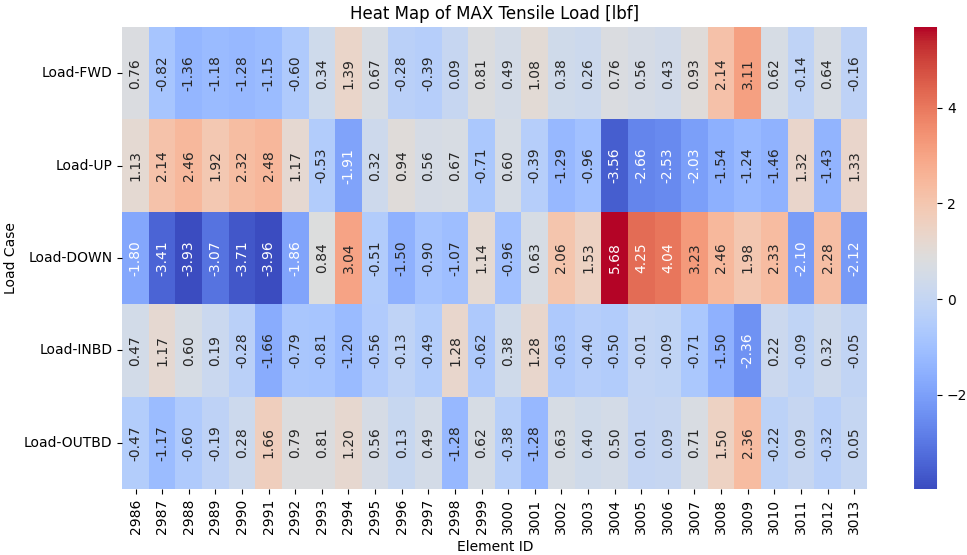
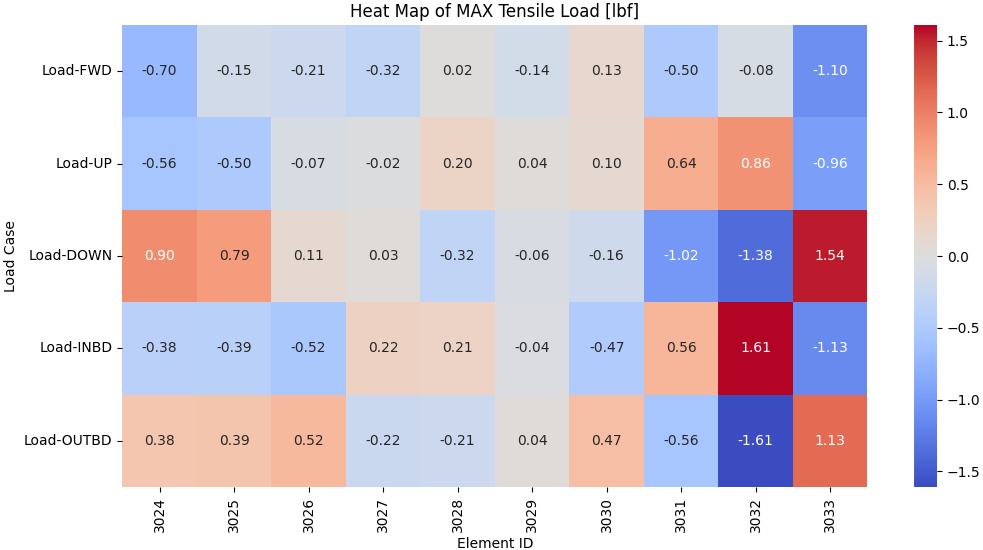
The screw in this joint configuration has an ultimate tensile and shear strength values of ftu=2,055 lbf and fsu=1,291 lbf, respectively. As illustrated previously,
The maximum tensile force values in all parts are less than 6 lbf. Hence, the screws pass by observation against tensile load.
The maximum shear force value in part 1 is 114.27 lbf and it occurs at element 3016. Assuming that this load will be carried by only the two screws, the shear load per screw is 114.27/2=57.14 lbf. Hence, the screw pass by observation against shear load.
The maximum shear force value in part 2 is 367.91 lbf and it occurs at element 3007. Assuming that this load will be carried by only three screws, the shear load per screw is 367.91/3=122.64 lbf. Hence, the screw pass by observation against shear load.
The maximum shear force value in part 3 is 553.22 lbf and it occurs at element 3026. Assuming that this load will be carried by only two screws, the shear load per screw is 553.22/2=276.61 lbf. Hence, the screw pass by observation against shear load.
Mission Computer and Composite Table
As illustrated in the corresponding figure, the Mission Computer is fixed to the Composite Table (TEKLAM AA207-66-1000) through 4x NAS1801-3-11 Screws (two at each support) in one of the workstations, and MS35206-244 Screws in the other one. Both of these screws go through NAS1832-3-4 Blind Threaded Inserts.
Moreover, the composite shelf is fixed to the tube structure through Attachment clips, load spreaders, NAS1801-3-11 bolts, and 1832-3-6 Blind Threaded Inserts (twelve attachment points).
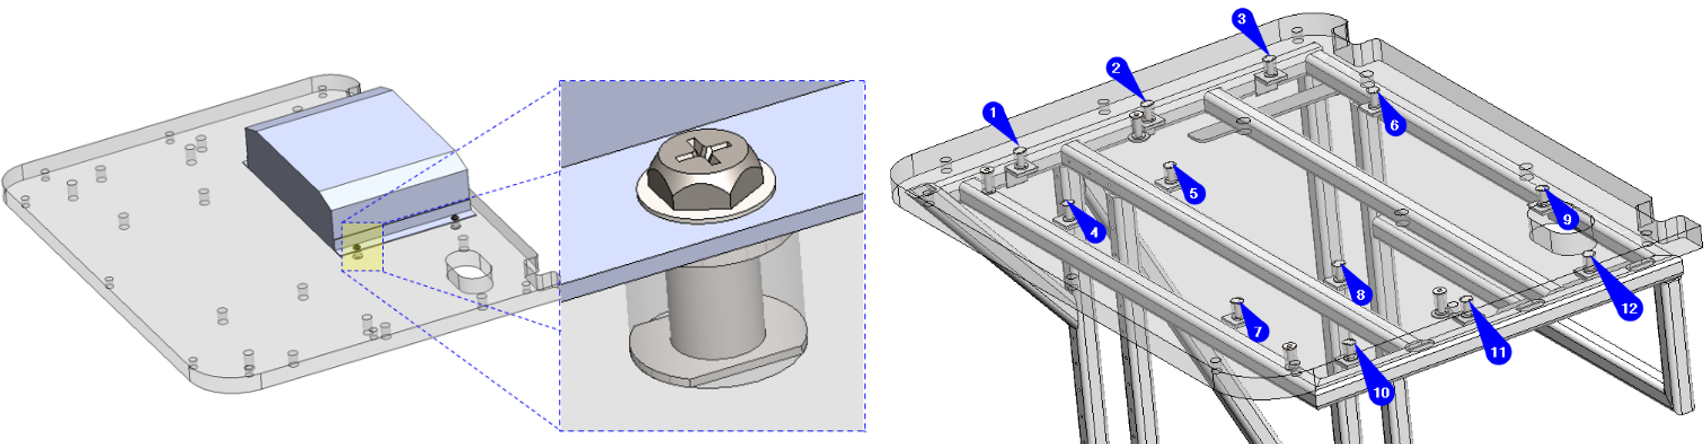
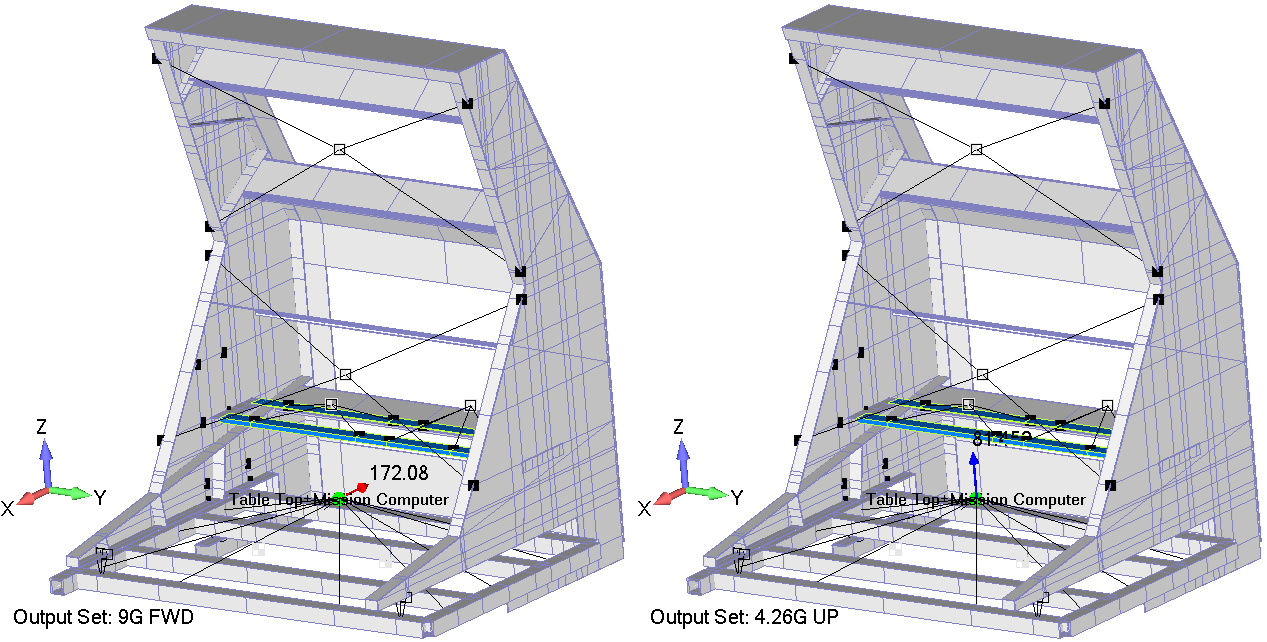
As shown in the corresponding figure, the maximum shear and tensile loads (172.08 lbf and 81.5 lbf, respectively) due to the mission computer and the composite shelf occure at the forward and upward load cases, respectively. NAS1801-3-8 screws are used to mount the mission computer in one of the workstations, and MS35206-244 Screws are used in the second workstation, which are both go through NAS1832-3-4 Blind Inserts. The lowest tensile and shear strengths in this configuration belong to NAS1832-3-4 inserts, where ftu= 641 lbf and fsu=526 lbf and those values will be the joint allowable. Assuming that the maximum loads are carried by the NAS1832-3-4 6 Blind Threaded Inserts only, these insert pass by observation. Moreover, the NAS1801-3-8 and MS35206-244 Screws pass by comparison.
In addition, NAS1801-3-11 screws are used to mount the composite table to the tube structure, which pass through NAS1832-3-6 Blind Threaded Inserts. The lowest tensile and shear strengths in this configuration belong to NAS1832-3-6 inserts, where ftu= 961 lbf and fsu=921 lbf and those values will be the joint allowable. Assuming that the maximum loads are carried by the NAS1832-3-6 Blind Threaded Inserts only, these insert pass by observation. Moreover, the NAS1801-3-11 Screws pass by comparison.
Table Attachment Clip
As shown in the corresponding figure, the Table Attachment Clip in fixed to:
the tube structure through two CR3213 (ARN4) Rivets in diagonal way.
Composite Table through one NAS1801-3-11 Screw that pass through the spreader, the clip, and the composite table.
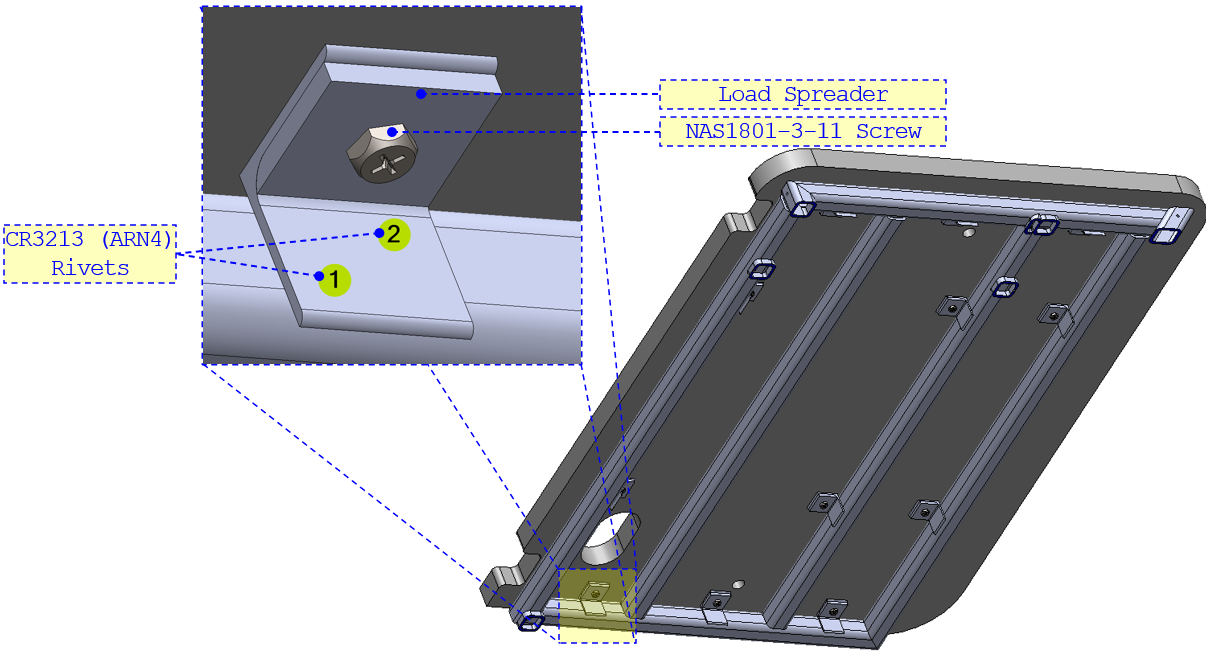
The figure below illustrates the reactions at these attachment points of the clips in all load cases. the applicable table and the applicable table summarise the forces in all load-case scenarios.
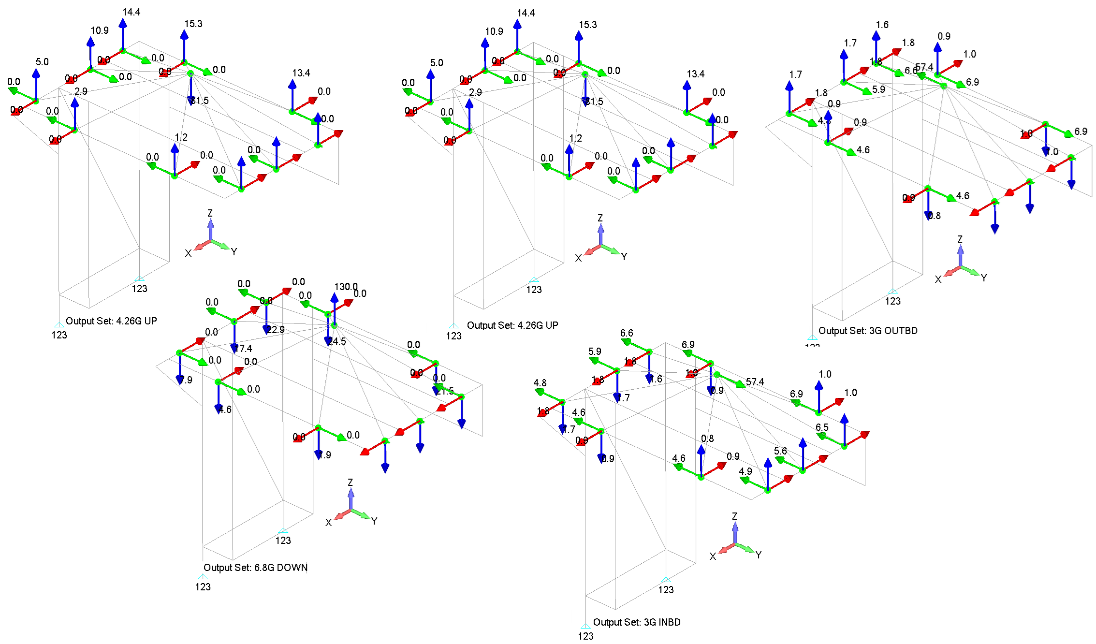
The nodal reaction forces along x-, y-, and z-axes at the attachment clips
| FWD | UP | DOWN | INBD | OUTBD | |||||||||||
|---|---|---|---|---|---|---|---|---|---|---|---|---|---|---|---|
| ID | Fx | Fy | Fz | Fx | Fy | Fz | Fx | Fy | Fz | Fx | Fy | Fz | Fx | Fy | Fz |
| 4 | -18.72 | -1.92 | 9.28 | 0.00 | 0.00 | 2.89 | 0.00 | 0.00 | -4.62 | 0.89 | -4.61 | -0.91 | -0.89 | 4.61 | 0.91 |
| 6 | -15.69 | -1.92 | 8.97 | 0.00 | 0.00 | 1.16 | 0.00 | 0.00 | -1.85 | -0.90 | -4.61 | 0.78 | 0.90 | 4.61 | -0.78 |
| 99 | -15.58 | 1.96 | -9.47 | 0.00 | 0.00 | 13.45 | 0.00 | 0.00 | -21.47 | -0.96 | -6.89 | 0.97 | 0.96 | 6.89 | -0.97 |
| 112 | -18.86 | 1.96 | -9.13 | 0.00 | 0.00 | 15.32 | 0.00 | 0.00 | -24.46 | 0.97 | -6.89 | -0.85 | -0.97 | 6.89 | 0.85 |
| 622 | -20.24 | 1.41 | -6.39 | 0.00 | 0.00 | 14.37 | 0.00 | 0.00 | -22.94 | 1.79 | -6.57 | -1.64 | -1.79 | 6.57 | 1.64 |
| 624 | -20.24 | 0.32 | -1.19 | 0.00 | 0.00 | 10.88 | 0.00 | 0.00 | -17.37 | 1.79 | -5.92 | -1.67 | -1.79 | 5.92 | 1.67 |
| 663 | -20.24 | -1.54 | 7.63 | 0.00 | 0.00 | 4.97 | 0.00 | 0.00 | -7.94 | 1.79 | -4.83 | -1.74 | -1.79 | 4.83 | 1.74 |
| 3005 | -14.17 | 1.25 | -6.26 | 0.00 | 0.00 | 10.40 | 0.00 | 0.00 | -16.60 | -1.79 | -6.47 | 1.73 | 1.79 | 6.47 | -1.73 |
| 3006 | -14.17 | -0.16 | 0.46 | 0.00 | 0.00 | 5.89 | 0.00 | 0.00 | -9.40 | -1.79 | -5.64 | 1.68 | 1.79 | 5.64 | -1.68 |
| 3007 | -14.17 | -1.35 | 6.10 | 0.00 | 0.00 | 2.11 | 0.00 | 0.00 | -3.37 | -1.79 | -4.94 | 1.64 | 1.79 | 4.94 | -1.64 |
The shear and tensile loads at the CR3213 Rivets.
| FWD | UP | DOWN | INBD | OUTBD | ||||||
|---|---|---|---|---|---|---|---|---|---|---|
| ID | Shear | Tensile | Shear | Tensile | Shear | Tensile | Shear | Tensile | Shear | Tensile |
| 4 | 20.90 | -1.92 | 2.89 | 0.00 | 4.62 | 0.00 | 1.27 | -4.61 | 1.27 | 4.61 |
| 6 | 18.07 | -1.92 | 1.16 | 0.00 | 1.85 | 0.00 | 1.19 | -4.61 | 1.19 | 4.61 |
| 99 | 18.23 | 1.96 | 13.45 | 0.00 | 21.47 | 0.00 | 1.37 | -6.89 | 1.37 | 6.89 |
| 112 | 20.96 | 1.96 | 15.32 | 0.00 | 24.46 | 0.00 | 1.29 | -6.89 | 1.29 | 6.89 |
| 622 | 21.23 | 1.41 | 14.37 | 0.00 | 22.94 | 0.00 | 2.42 | -6.57 | 2.42 | 6.57 |
| 624 | 20.28 | 0.32 | 10.88 | 0.00 | 17.37 | 0.00 | 2.45 | -5.92 | 2.45 | 5.92 |
| 663 | 21.63 | -1.54 | 4.97 | 0.00 | 7.94 | 0.00 | 2.49 | -4.83 | 2.49 | 4.83 |
| 3005 | 15.49 | 1.25 | 10.40 | 0.00 | 16.60 | 0.00 | 2.49 | -6.47 | 2.49 | 6.47 |
| 3006 | 14.17 | -0.16 | 5.89 | 0.00 | 9.40 | 0.00 | 2.46 | -5.64 | 2.46 | 5.64 |
| 3007 | 15.43 | -1.35 | 2.11 | 0.00 | 3.37 | 0.00 | 2.43 | -4.94 | 2.43 | 4.94 |
As shown in the corresponding table, the maximum shear and tensile loads carried by CR3213 rivet are fsu=24.46/2=12.23 lbf and ftu=6.89/2=3.45 lbf, respectively, which belong to the downward and outboard load cases, respectively. The CR3213 rivet in this configuration has a tensile and shear strengths values of 228 lbf and 316 lbf, respectively. Assuming that the maximum loads are carried by these rivets only, these rivets pass by observation.
The Tension Clip
The tension clip installation has two significant failure modes, failure of the clip in bending and tension failure of the fastener.
Clip Bending:
The allowable applied load to yield the angle in bending per one inch of angle can be expressed as below:
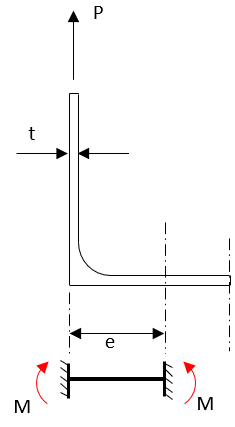
Where
is the allowable moment to yield
is the minimum factor from yield allowable to ultimate allowable. For extruded aluminium, .
: is the shape factor for a rectangular section, namely .
is the eccentricity of the clip, i.e. the distance between the bolt’s axis and the flange’s outer surface.
is the tensile yield strength of the material
is the second moment of area for a unit length of angle flange; namely, t3/12
is the distance from the flange cross section neutral axis to the outer surface; namely, t/2
For conservatism, the load spreader will be omitted from the analysis. Therefore, the ultimate allowable applied load per one inch of angle can be expressed as below:
Based on the applicable data, the maximum tensile load on the flange is 24.46 lbf which belong to the downward load case. Hence, the clip pass by observation against bending.
Fastener Tension:
The moment reaction at the fastener location is replaced by a couple reaction between the fastener position and an assumed triangular bearing reaction between the underside of the clip and the support structure. For simplicity, the moment is calculated at the fastener position assuming rotational fixity at the fastener position and the outstanding web. This can be described by the following equation:
The additional force due to the couple reaction is calculated as:
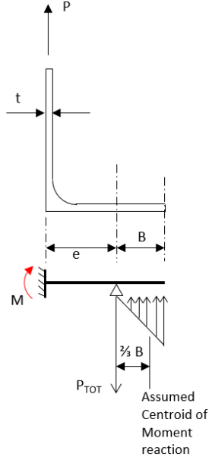
Based on the applicable data, the maximum tensile load acting on the flange is 24.46 lbf, which belong to the downward load case. Therefore, the total maximum tensile force on the NAS1801-3-11 bolt can be calculated as below
The NAS1801-3-11 screw pass through NAS1832-3-6 Blind Threaded Inserts. The lowest tensile strength in this configuration belong to NAS1832-3-6 inserts, where ftu= 961 lbf. Assuming that the maximum tensile loads are carried by the NAS1832-3-6 Blind Threaded Inserts only, these insert pass by observation. Moreover, the NAS1801-3-11 Screws pass by comparison.
Monitor Brackets
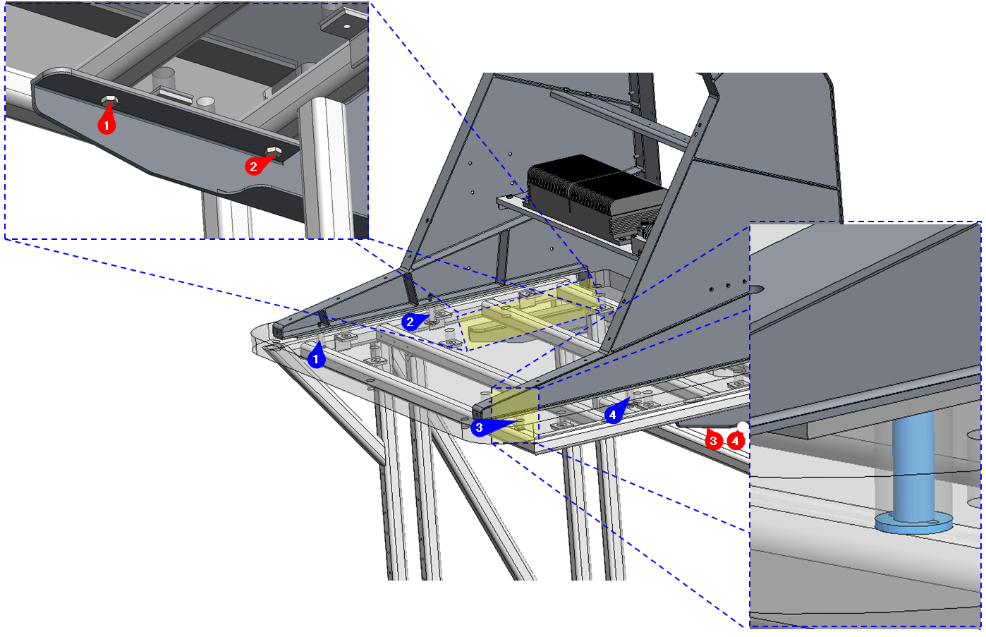
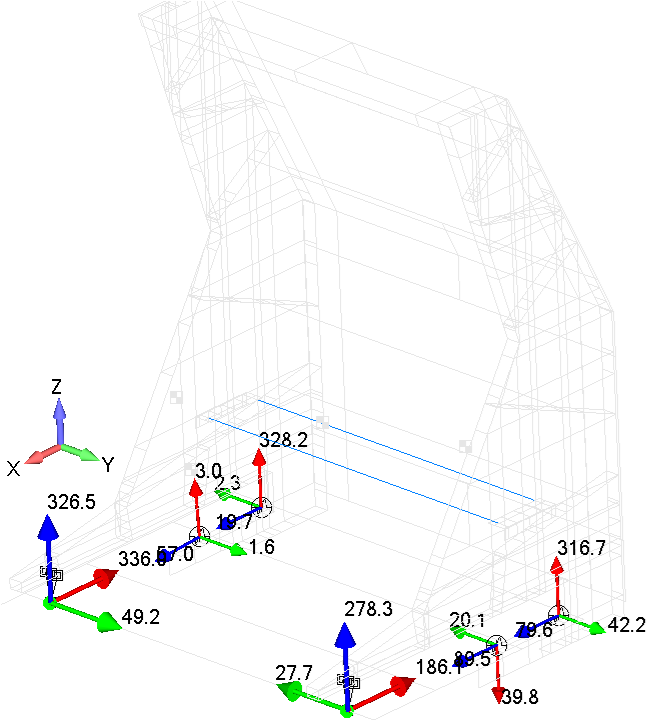
The shear and tensile loads at the attachment points.
| FWD | UP | DOWN | INBD | OUTBD | ||||||
|---|---|---|---|---|---|---|---|---|---|---|
| ID | Shear | Tensile | Shear | Tensile | Shear | Tensile | Shear | Tensile | Shear | Tensile |
| Node 3 | 897.55 | 326.51 | 53.69 | 58.67 | 85.70 | -93.65 | 110.17 | -0.86 | 110.17 | 0.86 |
| Node 8 | 494.47 | 278.27 | 94.86 | 59.84 | 151.42 | -95.52 | 162.91 | -2.40 | 162.91 | 2.40 |
| CBUSH 2095 | 328.18 | -19.75 | 115.51 | -8.24 | 184.39 | 13.15 | 149.83 | 68.39 | 149.83 | -68.39 |
| CBUSH 2104 | 3.37 | -57.03 | 9.95 | 5.58 | 15.88 | -8.91 | 28.44 | 19.17 | 28.44 | -19.17 |
| CBUSH 2347 | 319.47 | -79.62 | 98.80 | -10.02 | 157.71 | 15.99 | 141.85 | -63.54 | 141.85 | 63.54 |
| CBUSH 2348 | 44.57 | -89.54 | 21.36 | -14.76 | 34.09 | 23.55 | 34.49 | -31.96 | 34.49 | 31.96 |
As shown in the corresponding table, the maximum shear and tensile loads carried by each AN3-15A screw are fsu=897.55/2=448.8 lbf and ftu=326.51/2=163.26 lbf, respectively, which belong to the forward load case. The lowest tensile and shear strengths in this configuration belong to the NAS1834-3-1000, where ftu= 1,324 lbf and fsu=1,026 lbf and those values will be the joint allowable. Assuming that the maximum loads are carried by the NAS1834-3-1000 inserts only, these insert pass by observation. Moreover, the AN3-15A Screws pass by comparison.
Similarly, the maximum shear and tensile loads carried by AN3-4A screw are fsu=328.18 lbf and ftu=89.54 lbf, respectively, which belong to the forward load case. The AN3-4A Screws pass through (i) Monitor Bracket, (ii) KYDEX slide, and (iii) tube structure. The allowable tensile and shear strengths in this configuration are ftu= 2,210 lbf and fsu=1,947 lbf. Assuming that the maximum loads are carried by the AN3-4A only, these screws pass by observation.
Monitor Close-Out
As illustrated in the corresponding figure, the Monitor Close-Out is attached to the Monitor Bracket through 24XNAS8602-2 Screws (twelve at Inboard and Outboard sides).
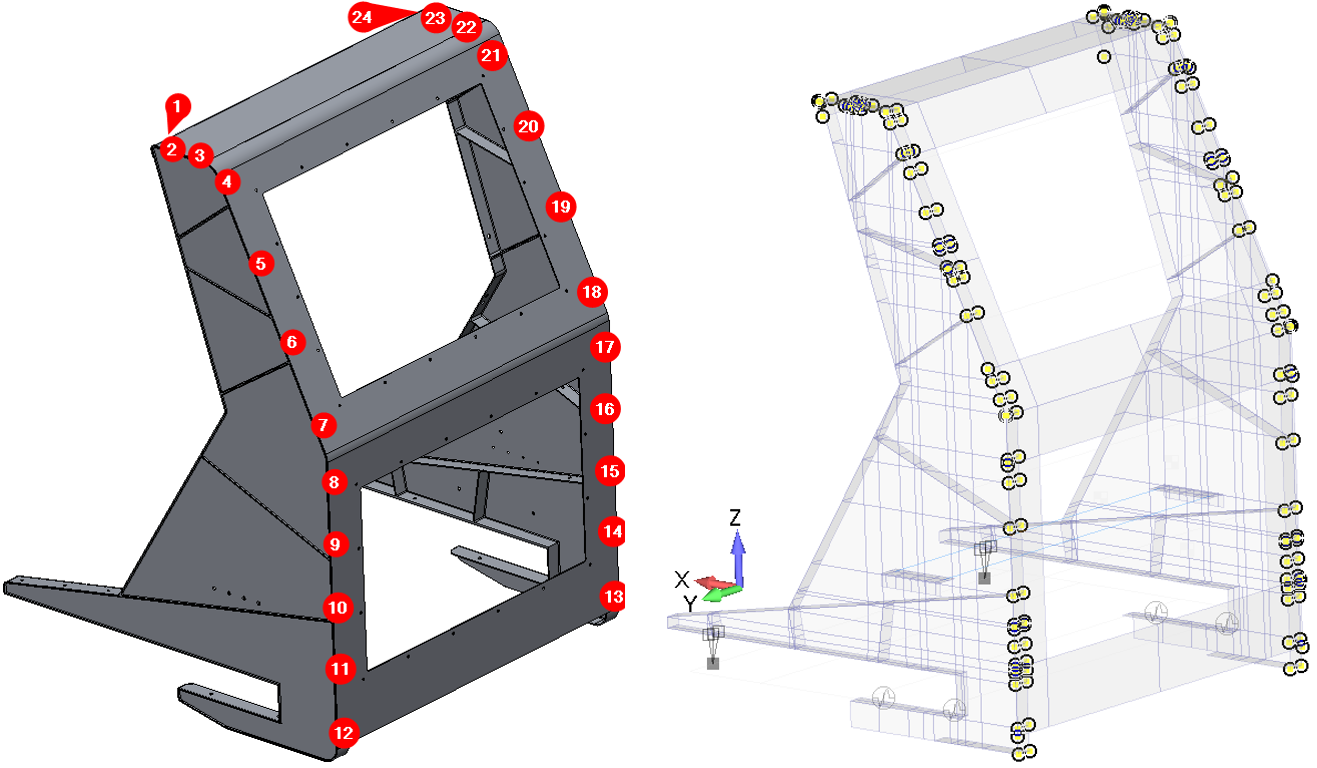
For each load-case, the absolute maximum nodal force along x-, y-, and z-axes were extracted and tabulated in the applicable table. The absolute maximum nodal force equals 167.54 lbf. This value will, conservatively, be used to asses the NAS8602-2 against tensile failure. Moreover, the maximum two nodal force equal to 167.54 lbf and 111.17 lbf which belong to different load-case senarios and it occur at two different elements. These maximum two values will, conservatively, be assumed to be in the shear direction in one load-case senario. Therefore, the maximum shear load at NAS8602-2 screw equals
The absolute maximum nodal force along x-, y-, and z-axes.
| FWD | UP | DOWN | INBD | OUTBD | |||||||||||
|---|---|---|---|---|---|---|---|---|---|---|---|---|---|---|---|
| Fx | Fy | Fz | Fx | Fy | Fz | Fx | Fy | Fz | Fx | Fy | Fz | Fx | Fy | Fz | |
| Value | 43.31 | 88.23 | 111.17 | 33.38 | 20.84 | 34.75 | 53.28 | 33.27 | 55.47 | 35.32 | 167.54 | 88.98 | 35.32 | 167.54 | 88.98 |
| Node | 1114 | 1210 | 1662 | 2031 | 2005 | 1662 | 2031 | 2005 | 1662 | 1130 | 2349 | 2402 | 1130 | 2349 | 2402 |
The NAS8602-2 Screws in this configuration have an ultimate tensile and shear strength values of 2,055 lbf and 1,291 lbf, respectively. Assuming the entire tensile and shear loads are carried by only these screws, these screws pass by observation.
Shelf Braces and its Equipment
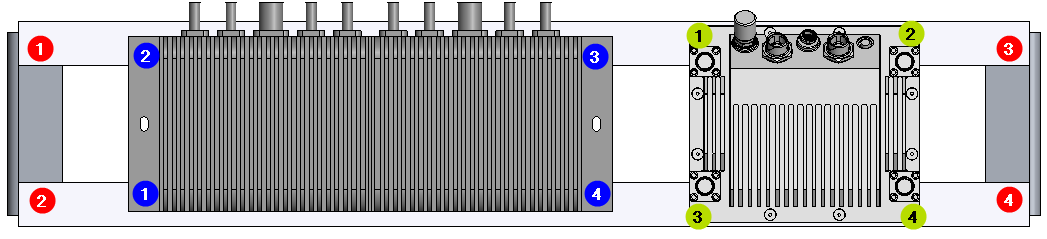
Shelf Braces Beams’ Attachment Points
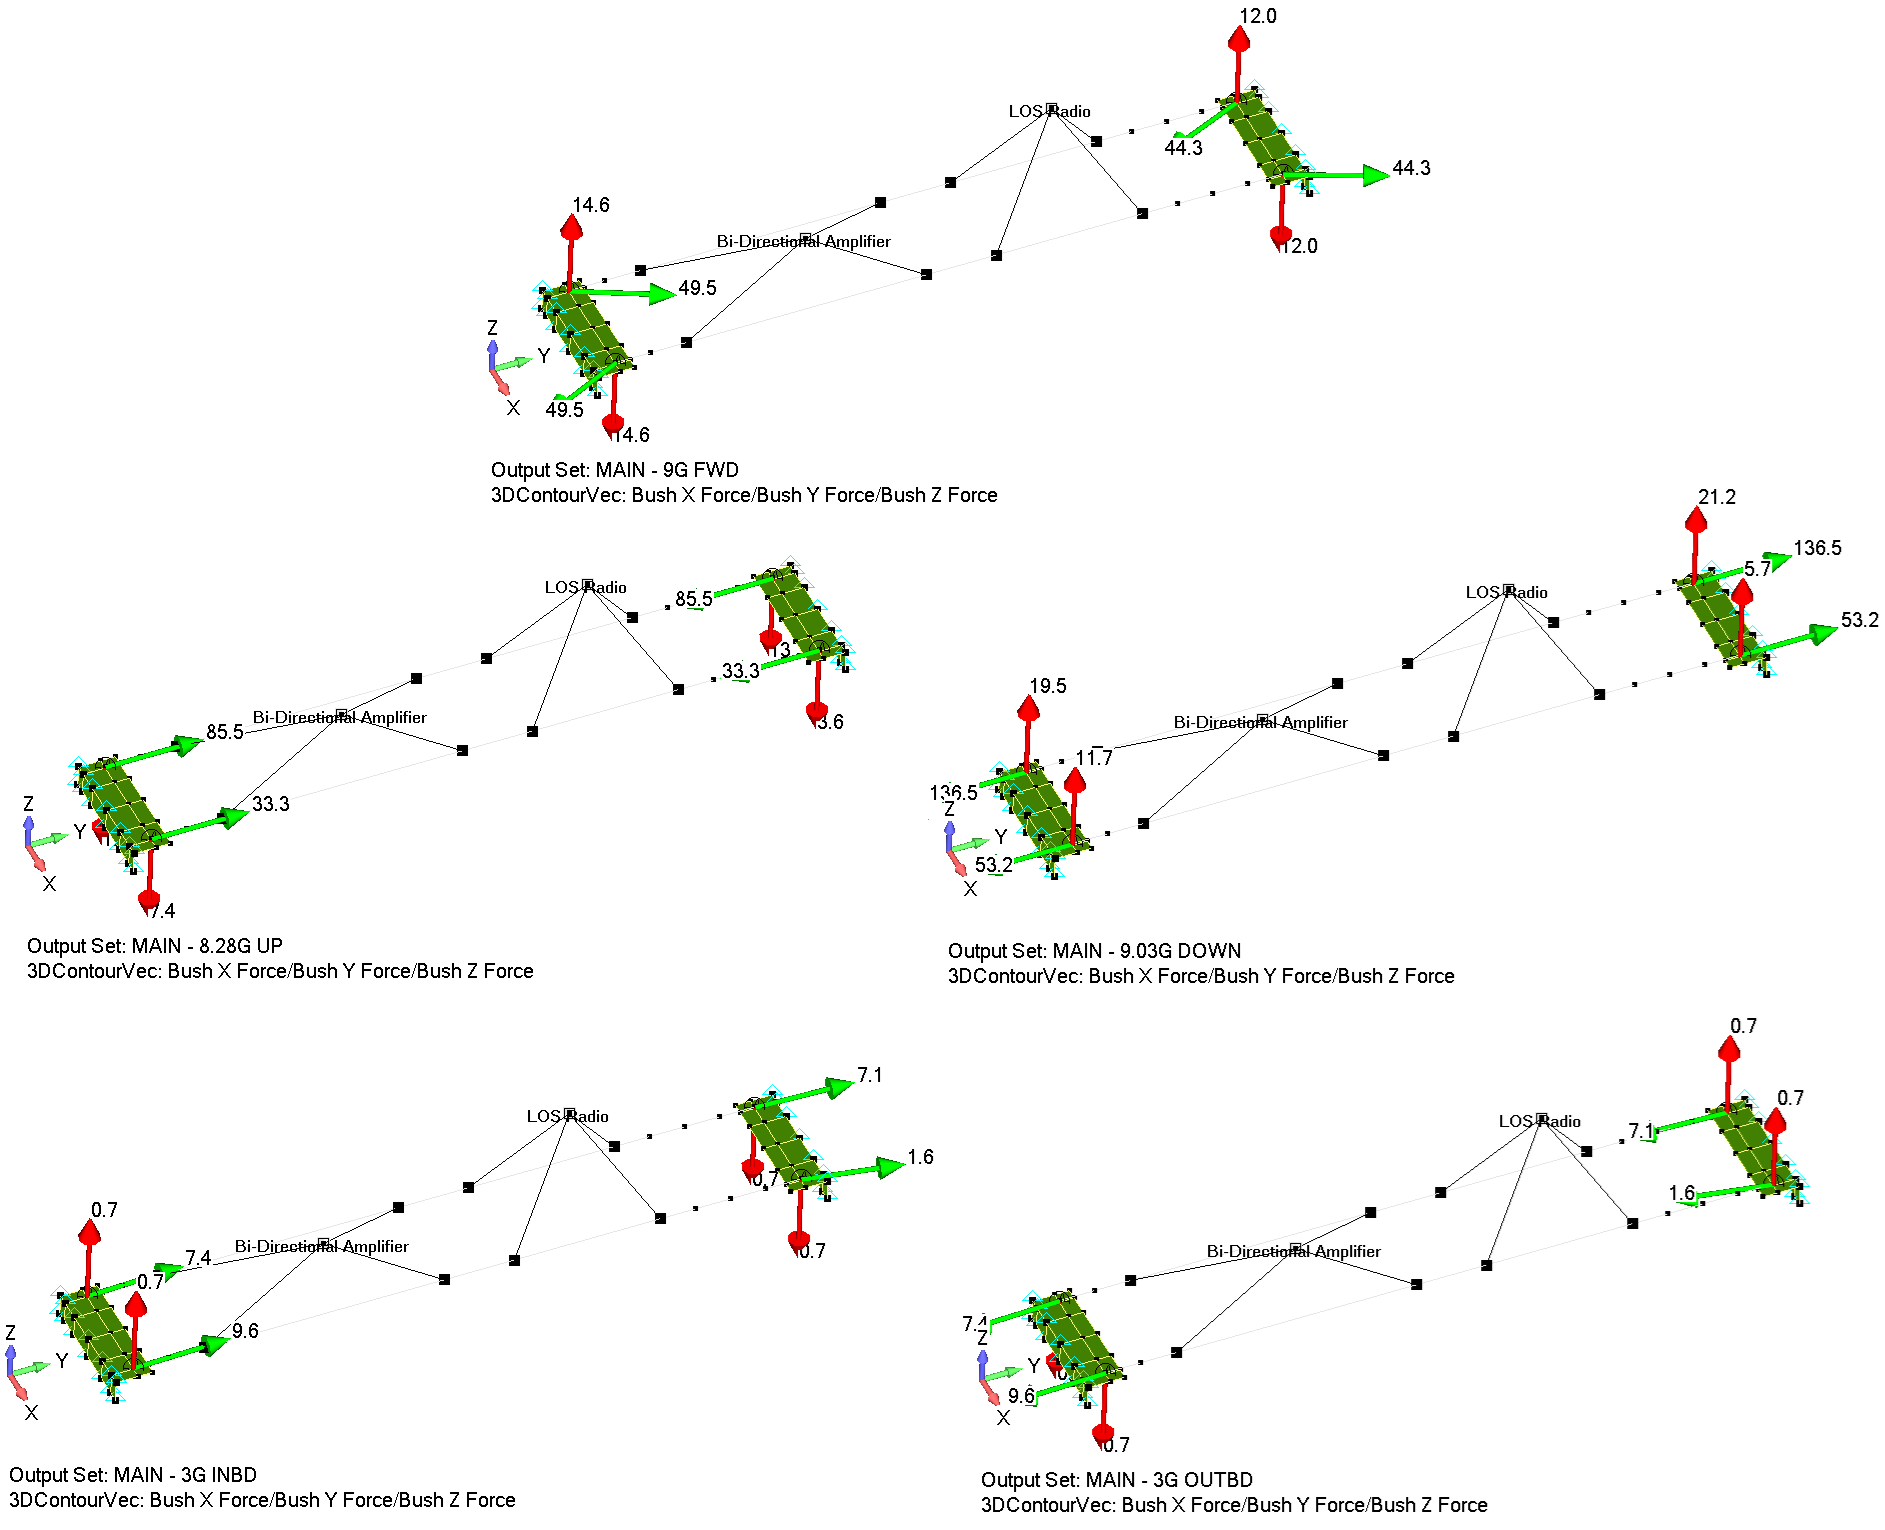
The NAS1801-3-8 Screws at this location have an ultimate tensile and shear strength values of 2,975 lbf and 1,496 lbf, respectively. Therefore, these screws pass by observation.
Equipment Attachment Points
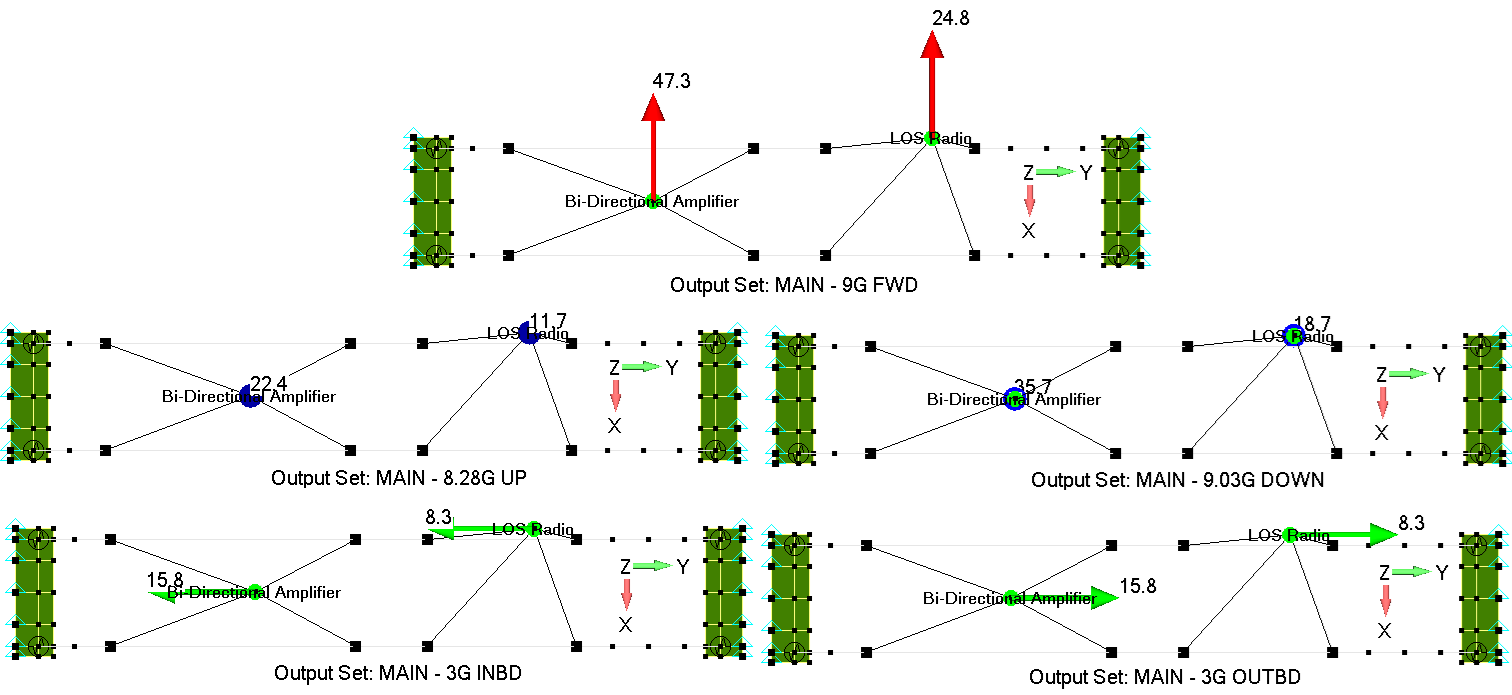
As shown in the corresponding figure, the maximum shear and tensile loads at the Bi-Directional Amplifier’s fasteners occure at the forward and upward load cases, respectively. The maximum shear and tensile loads at the LOS Radio’s fasteners occure at the forward and downward load cases, respectively. Both AN525-8R10 and AN525-832R8 Screws at this location have an ultimate tensile and shear strength values of 1,525 lbf and 847 lbf, respectively. Assuming that the maximum loads are carried by these screws only, these screws pass by observation.
Shelf Clips
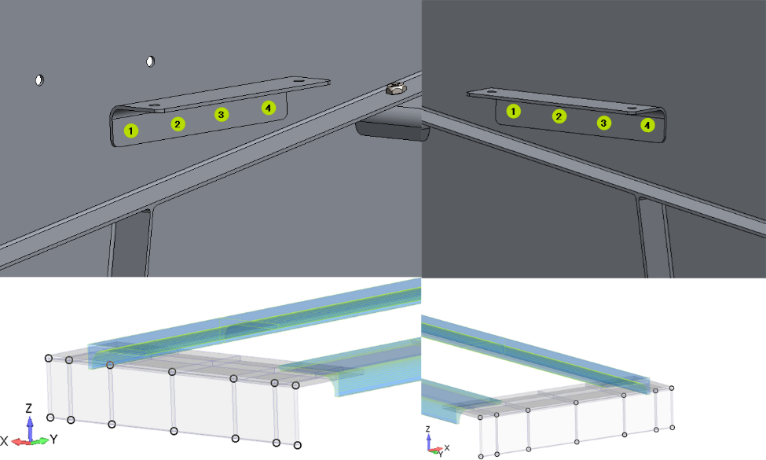
The Nodal Summed Forces for Shelf Clips Attachment Points’ Nodes
| FWD | UP | DOWN | INBD | OUTBD | |||||||||||
|---|---|---|---|---|---|---|---|---|---|---|---|---|---|---|---|
| ID | Fx | Fy | Fz | Fx | Fy | Fz | Fx | Fy | Fz | Fx | Fy | Fz | Fx | Fy | Fz |
| 2536 | 0.77 | 14.39 | 3.06 | 0.66 | 8.36 | 0.56 | -1.05 | -13.34 | -0.89 | 0.25 | -1.69 | 0.59 | -0.25 | 1.69 | -0.59 |
| 2537 | 2.72 | -15.93 | -2.39 | -1.75 | 17.48 | 0.05 | 2.80 | -27.90 | -0.08 | -0.73 | -1.70 | 0.22 | 0.73 | 1.70 | -0.22 |
| 2538 | -5.44 | 10.21 | 6.98 | 0.18 | 4.40 | 0.89 | -0.28 | -7.03 | -1.42 | 2.83 | -4.06 | -0.71 | -2.83 | 4.06 | 0.71 |
| 2539 | -2.04 | -10.98 | -2.42 | 0.03 | -1.35 | 1.00 | -0.05 | 2.16 | -1.60 | -1.61 | -6.96 | -0.68 | 1.61 | 6.96 | 0.68 |
| 2543 | -0.12 | -5.40 | 4.33 | -1.19 | -14.72 | 2.03 | 1.90 | 23.50 | -3.24 | -2.01 | 0.02 | 1.70 | 2.01 | -0.02 | -1.70 |
| 2544 | -2.96 | -6.32 | -9.69 | -2.88 | 4.00 | 7.51 | 4.60 | -6.38 | -11.99 | -4.97 | 3.30 | -0.92 | 4.97 | -3.30 | 0.92 |
| 2545 | -7.44 | 10.48 | 4.64 | 2.86 | 2.21 | 0.94 | -4.56 | -3.53 | -1.50 | 5.22 | -0.31 | 2.11 | -5.22 | 0.31 | -2.11 |
| 2546 | -0.67 | 1.88 | -0.83 | -0.26 | 8.28 | 2.25 | 0.42 | -13.22 | -3.59 | -2.40 | -2.03 | -1.70 | 2.40 | 2.03 | 1.70 |
| 2547 | -3.41 | 20.00 | -0.94 | 1.29 | 15.16 | 0.78 | -2.05 | -24.20 | -1.25 | 1.41 | -3.54 | -3.03 | -1.41 | 3.54 | 3.03 |
| 2548 | -3.18 | -20.84 | -11.17 | 0.12 | 27.06 | 5.90 | -0.19 | -43.19 | -9.42 | -1.96 | -2.61 | -1.89 | 1.96 | 2.61 | 1.89 |
| 2556 | -14.89 | -36.43 | 2.03 | 1.92 | -16.66 | -0.20 | -3.07 | 26.60 | 0.32 | 9.20 | 3.54 | 1.43 | -9.20 | -3.54 | -1.43 |
| 2558 | -3.41 | -1.44 | 1.48 | 0.51 | 0.59 | 0.08 | -0.82 | -0.94 | -0.12 | 2.10 | 0.39 | -0.46 | -2.10 | -0.39 | 0.46 |
| 2560 | 2.75 | 0.95 | 1.49 | -1.40 | -3.74 | -0.97 | 2.24 | 5.97 | 1.55 | -1.90 | -0.34 | 0.92 | 1.90 | 0.34 | -0.92 |
| 2561 | -4.43 | 24.48 | 3.44 | -0.07 | -22.78 | -1.41 | 0.11 | 36.37 | 2.25 | -4.82 | 3.73 | 0.36 | 4.82 | -3.73 | -0.36 |
| 2570 | 1.09 | -14.27 | 2.20 | 0.62 | -6.74 | -0.32 | -0.99 | 10.76 | 0.52 | -0.22 | -2.22 | -0.50 | 0.22 | 2.22 | 0.50 |
| 2571 | 1.91 | 15.42 | -1.61 | -1.92 | -19.25 | 0.33 | 3.06 | 30.73 | -0.52 | 0.71 | -2.20 | -0.26 | -0.71 | 2.20 | 0.26 |
| 2572 | -3.54 | -6.14 | 6.34 | 0.49 | -5.22 | -0.09 | -0.78 | 8.34 | 0.14 | -2.75 | -4.81 | 0.78 | 2.75 | 4.81 | -0.78 |
| 2573 | -2.11 | 7.75 | -2.28 | 0.15 | 2.77 | 1.22 | -0.23 | -4.42 | -1.95 | 1.50 | -6.92 | 0.62 | -1.50 | 6.92 | -0.62 |
| 2577 | -1.06 | 3.86 | 6.17 | -1.58 | 14.58 | 1.53 | 2.52 | -23.28 | -2.44 | 2.02 | 0.13 | -1.63 | -2.02 | -0.13 | 1.63 |
| 2578 | -4.36 | 8.01 | -8.25 | -3.23 | -5.35 | 8.98 | 5.15 | 8.53 | -14.34 | 4.61 | 3.61 | 0.89 | -4.61 | -3.61 | -0.89 |
| 2579 | -4.02 | -13.98 | 7.22 | 2.62 | -0.39 | 0.83 | -4.19 | 0.62 | -1.33 | -4.84 | -0.08 | -1.95 | 4.84 | 0.08 | 1.95 |
| 2580 | -1.24 | -2.03 | -2.40 | -0.29 | -7.53 | 1.65 | 0.47 | 12.01 | -2.64 | 2.48 | -2.13 | 1.79 | -2.48 | 2.13 | -1.79 |
| 2581 | -2.37 | -19.70 | -3.62 | 1.09 | -13.07 | 0.63 | -1.75 | 20.86 | -1.00 | -1.36 | -4.63 | 2.90 | 1.36 | 4.63 | -2.90 |
| 2582 | -3.17 | 20.70 | -10.66 | 0.34 | -29.73 | 6.56 | -0.55 | 47.45 | -10.47 | 1.83 | -3.49 | 1.83 | -1.83 | 3.49 | -1.83 |
| 2589 | -9.33 | 38.29 | 2.67 | 2.48 | 12.23 | -0.78 | -3.96 | -19.52 | 1.25 | -8.84 | 4.54 | -1.60 | 8.84 | -4.54 | 1.60 |
| 2590 | -2.18 | 3.30 | -0.62 | 0.83 | 0.28 | -0.89 | -1.33 | -0.44 | 1.42 | -2.17 | 0.72 | 0.39 | 2.17 | -0.72 | -0.39 |
| 2591 | 1.30 | -2.42 | 1.59 | -1.61 | 4.48 | -1.19 | 2.56 | -7.14 | 1.90 | 1.88 | -0.09 | -0.81 | -1.88 | 0.09 | 0.81 |
| 2592 | -5.38 | -23.84 | 3.24 | -0.01 | 24.65 | -1.79 | 0.01 | -39.35 | 2.86 | 4.53 | 4.44 | -0.36 | -4.53 | -4.44 | 0.36 |
For each load-case, the absolute maximum nodal force along x-, y-, and z-axes were extracted and tabulated in the applicable table. The absolute maximum nodal force equals 47.45 lbf. This value will, conservatively, be used to asses the MS20426AD4 rivet against tensile failure. Moreover, the maximum two nodal force equal to 47.45 lbf and 38.29 lbf which belong to different load-case senarios and it occur at two different elements. These maximum two values will, conservatively, be assumed to be in the shear direction in one load-case senario. Therefore, the maximum shear load at MS20426AD4 rivet equals
The absolute maximum nodal force along x-, y-, and z-axes.
| FWD | UP | DOWN | INBD | OUTBD | |||||||||||
|---|---|---|---|---|---|---|---|---|---|---|---|---|---|---|---|
| Fx | Fy | Fz | Fx | Fy | Fz | Fx | Fy | Fz | Fx | Fy | Fz | Fx | Fy | Fz | |
| Value | 14.89 | 38.29 | 11.17 | 3.23 | 29.73 | 8.98 | 5.15 | 47.45 | 14.34 | 9.20 | 6.96 | 3.03 | 9.20 | 6.96 | 3.03 |
| Node | 2556 | 2589 | 2548 | 2578 | 2582 | 2578 | 2578 | 2582 | 2578 | 2556 | 2539 | 2547 | 2556 | 2539 | 2547 |
The MS20426AD4 rivets in this configuration have an ultimate tensile and shear strength values of 427 lbf and 336 lbf, respectively. Assuming the entire tensile and shear loads are carried by only these rivets, these rivets pass by observation.
Cross-Braces Beams
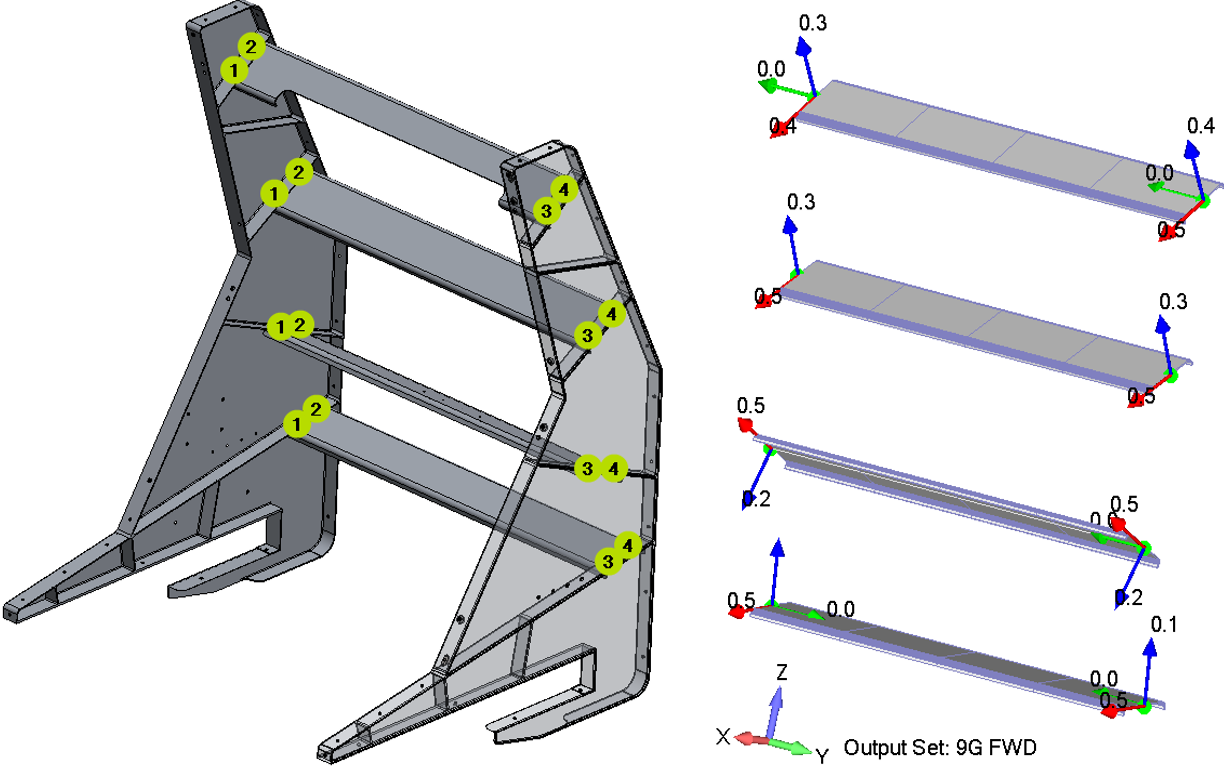
The Nodal Forces for the Cross-Braces Attachment Points.
| FWD | UP | DOWN | INBD | OUTBD | ||||||||||||
|---|---|---|---|---|---|---|---|---|---|---|---|---|---|---|---|---|
| Brace No. | ID | Fx | Fy | Fz | Fx | Fy | Fz | Fx | Fy | Fz | Fx | Fy | Fz | Fx | Fy | Fz |
| 1 | 2597 | -0.45 | 0.00 | -0.35 | -0.16 | 0.00 | 0.21 | 0.26 | 0.00 | -0.34 | 0.00 | -0.19 | 0.00 | 0.00 | 0.19 | 0.00 |
| 2621 | -0.45 | 0.00 | -0.36 | -0.17 | 0.00 | 0.22 | 0.27 | 0.00 | -0.34 | 0.00 | -0.19 | 0.00 | 0.00 | 0.19 | 0.00 | |
| 2 | 30 | -0.45 | 0.00 | -0.30 | -0.14 | 0.00 | 0.22 | 0.22 | 0.00 | -0.34 | 0.00 | -0.18 | 0.00 | 0.00 | 0.18 | 0.00 |
| 84 | -0.45 | 0.00 | -0.30 | -0.14 | 0.00 | 0.22 | 0.22 | 0.00 | -0.34 | 0.00 | -0.18 | 0.00 | 0.00 | 0.18 | 0.00 | |
| 3 | 1421 | -0.49 | 0.00 | 0.20 | 0.09 | 0.00 | 0.23 | -0.15 | 0.00 | -0.37 | 0.00 | -0.18 | 0.00 | 0.00 | 0.18 | 0.00 |
| 2143 | -0.49 | 0.00 | 0.20 | 0.09 | 0.00 | 0.23 | -0.15 | 0.00 | -0.37 | 0.00 | -0.18 | 0.00 | 0.00 | 0.18 | 0.00 | |
| 4 | 1454 | -0.54 | 0.00 | -0.10 | -0.05 | 0.00 | 0.26 | 0.07 | 0.00 | -0.41 | 0.00 | -0.18 | 0.00 | 0.00 | 0.18 | 0.00 |
| 2162 | -0.54 | 0.00 | -0.10 | -0.05 | 0.00 | 0.26 | 0.07 | 0.00 | -0.41 | 0.00 | -0.18 | 0.00 | 0.00 | 0.18 | 0.00 | |
The NAS1801‑3‑8 Screws in this configuration have an ultimate tensile and shear strength values of 2,975 lbf and 1,496 lbf, respectively. As shown in the corresponding table, the maximum load among all components in all load-cases is 0.54 lbf. Assuming the entire tensile and shear loads are carried by only these screws, these screws pass by observation.
Network Cable Enclosure and Cabin Underfloor Equipment Installation
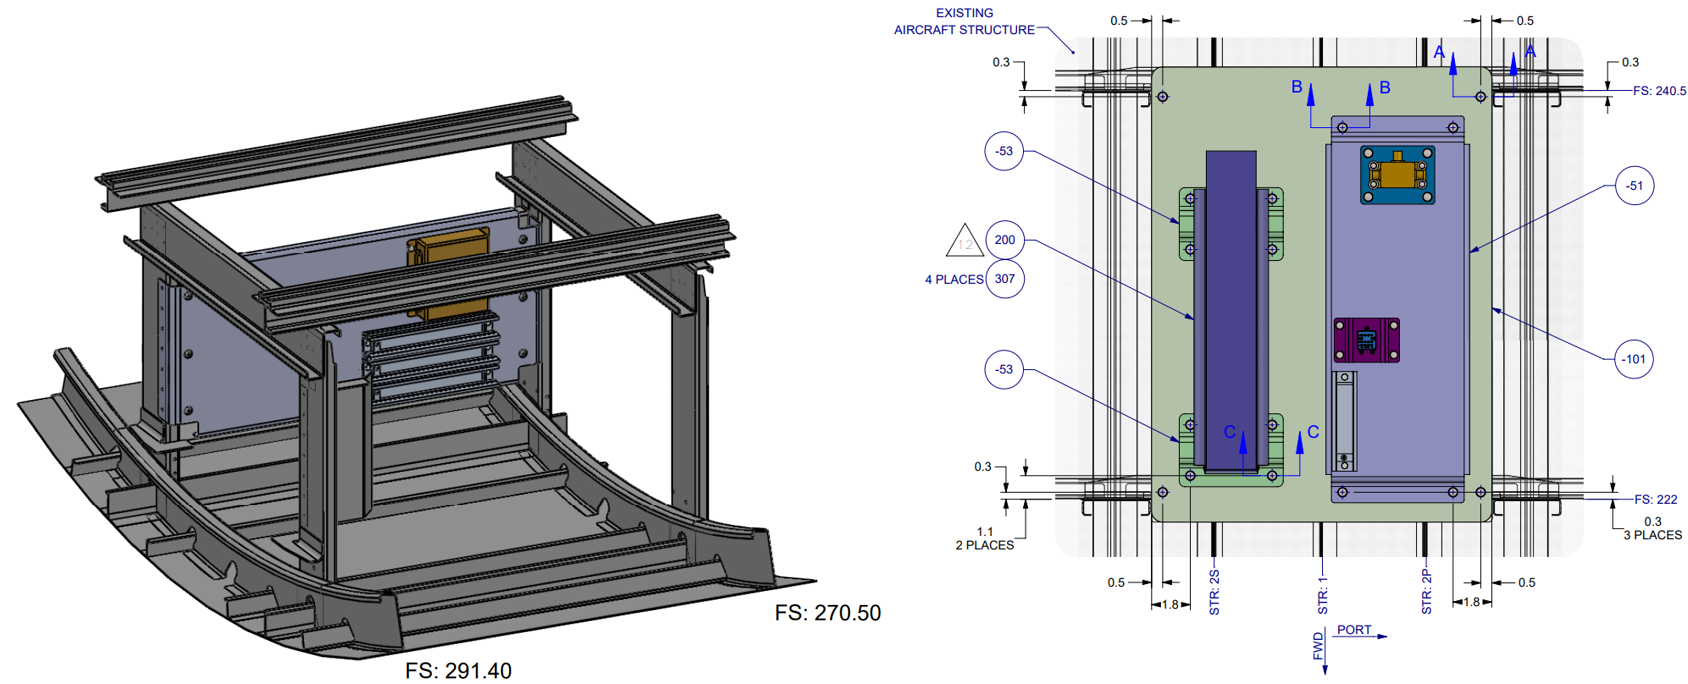
References
Structural Methods & Allowables
- MMPDS-15 - Metallic Materials Properties Development and Standardization
- Analysis and Design of Flight Vehicle Structures - E. F. Bruhn
- Aluminum Design Manual 2010
- Stress Analysis Manual - Air Force Flight Dynamics Laboratory, Wright-Patterson
- Fastener Design Manual - NASA Reference Publication 1228
Regulatory & Aircraft Load Basis
- Federal Aviation Regulations - 14 CFR Part 25
- DHC-8-100 Load Cases and Applied Loads
Fasteners & Hardware Data
- CherryMax Rivets technical data
- NAS528 Fastener Codes
- MS24693 technical data
- NAS1832 / NAS1834 insert technical data
- NAS8602 / NAS1801 fastener technical data
Track, Composite & Fitting Data
- ANCRA Aircraft Track technical data
- FE200744 stud technical data
- 40351 / 40352 Threaded Stud specifications
- TEKLAM AA207-66-1000 / AA207-33-1000 technical data